Wednesday, December 19, 2012

EM12c: JVMD Monitoring Sizing Tips

JVMD is a sampling tool that takes samples from JVM on a fixed frequency and then analyzes the collected data.

Following are some simple parameters that one needs to watch and can tune for JVMD monitoring.

1. Size of JVMD monitoring data depends on number of JVMs being monitored, sampling frequency for each JVM, number of active threads in a JVM, stack size of each of JVM thread etc.

2. Some info w.r.t. to JVMD sizing has been shared on http://docs.oracle.com/cd/E24628_01/install.121/e24089/sizing.htm#EMADV11866

3. JVMD polling and sampling frequency can be tuned from JVM pool setting page as given below

4. JVMD console/Engine parameters page can be used for following settings:

5. Along with these settings, it would be good idea to regularly monitor MGMT_AD4J_TS  tablespace growth for sometime like a month or so. After a month, if no new JVMs are added, tablespace size should become more constant and
predictable.

Note: These steps are also applicable for EM11g.

Monday, December 10, 2012

EM12c: How to create OS script based Metric Extension and deploy it on a target?

To create OS shell script based metric extension (ME), follow given steps:

1. Select Enterprise->Monitoring->Metric Extensions

2. Provide values for the metric extension properties in Create New wizard first page.


3. Provide shell scripting binary like /bin/sh, Shell Script name, Delimiter and Starts With expression as given below and Select Add button to add the shell script.


4. In this example, very simple script has been specified to explain the steps.


5. In next step of wizard, one needs to specify the output columns. As per given sample script, two columns Uptime and Users have been created here.


6. Select Credentials in next step to be used for this metric extension.


7. To test this metric extension, select Test Targets


8. Click on Run Test button to test the metric extension on Test target. You should see test output in Test Results panel.


9. Before submitting, review final definition for proposed metric extension.


10. Metric Extension is successfully created.


11. Once the metric extension is created, next step would be to save it as Deployable Draft as given below.


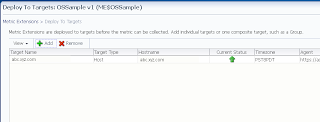
12. Once the status of metric extension shows as Deployable Draft. Select the metric extension and Deploy it to target as shown below.


13. You should see that the Metric Extension is deployed successfully.


14. After 15 min., Go to the target where this metric extension has been deployed. Select Monitoring->All Metrics. Yous should see following:

Thursday, November 29, 2012

EM12c: How to use Weblogic Domain Provisioning Profile with Gold Image?


Assumption: User has EM12cR2 with FMW 12.1.0.3 plugin

A WebLogic Domain Provisioning Profile consists of the Middleware Home, binaries and the domain configuration. One can create a WLS domain provisioning profile, save it in the Software Library, and then use the saved profile as the source for creating new WebLogic domains. This will ensure that future WebLogic installations follow a standard, consistent configuration.
Lets see an example how to create WLS domain provisioning profile.

Assumption:
1. Both source as well destination Host and source WLS domain are monitored target on EMCC.
2. You have the host credentials for both source machine as well as destination host.
3. Source Weblogic Domain should be JRF enabled.

Steps to create WLS domain provisioning profile:
1. Select Enterprise menu->Provisioning and Patching->Software Library.

2. From the Actions menu->click Create Folder to create a folder in which the profile you are creating is to be stored as shown below:
3. Select the newly created folder->Actions menu-> Create Entity-> Component


4. A Create Component window appears. From the Select Subtype drop-down list, select the "WebLogic Domain Provisioning Profile" component and click Continue.

5. In the Create WebLogic Domain Provisioning Profile wizard: Describe page, provide details as given below:


6. Click Next. The Create WebLogic Domain Provisioning Profile: Configure page appears. Do ensure that checkbox for 'Include the binaries from Middleware Home in the profile to be created.' is selected. Now using search icon, select the source Weblogic Domain, from which you would like to create the gold image.
Provide the host credentials in the lower panel as shown here:


7. Click Next. In the Review page, review the profile information and click Save and Upload.


8. The <Job Name> is displayed at the top of the page. Navigate to the Job Activity page and check the job status.
Once it has been completed, navigate to the Software Library page and confirm if all the components of the profile (WebLogic Domain, MWHome, and Profile) have a Ready Status. You can also verify if the profile has been successfully created by navigating to the Middleware Provisioning page. From the Enterprise menu, select Provisioning and Patching, then select Middleware Provisioning and check if the profile is displayed there. You can now use this profile as the source for future WebLogic Domain installations.

Steps to clone a WLS domain from a WLS domain provisioning profile:
1.  Select Enterprise menu->Provisioning and Patching-> Middleware Provisioning.

2. Select profile that was created in earlier steps from the Profiles section->click Provision. ( or select the Middleware Provisioning deployment procedure and click Launch)

3. In the Source page of Provisioning wizard, the selected component and its location is displayed. Click Next.


4. In the Middleware Provisioning: Destinations page, specify the destination hosts on which the WebLogic Domain is to be cloned. Also provide host credentials. For details look at given image:


In the lower panel "Destination Locations" section, one can specify the location of the Middleware Home on the Host machine. The Create a New Middleware Home option is selected by default.

In the Middleware Home Directory field, one enter the full path to the directory in which the Middleware Home is to be created.

In the JDK Home Location field, enter the absolute path to the JDK directory to be used on the destination Host. This field can be edited only if the JDK Home in the source domain is in an external location. If the JDK Home in the source domain is internal and installed in the Middleware Home, this field cannot be edited.

In the Working Directory field, specify the directory on the destination Host on which the cloning related files are temporarily stored.

5. Click Next. Now the Middleware Provisioning: Domain Configuration page appears. This page contains a set of links to several pages where one can enter the properties that are most likely to be reconfigured like domain name, listen addresses for the administration server and managed servers, Node Manager/Machine configuration and JDBC data sources. By default, the source domain configuration settings are used as default values for the destination domain.


In the Server Startup Mode, select JRF startup clssses.

For more details on configuration, go to step 15-23 on http://docs.oracle.com/cd/E24628_01/em.121/e27046/prov_fmw.htm#CHDIJCGE

6. In the Schedule page, select default values. Click Next.


7. On the Review page, review the details. click Submit.


8. In the Procedure Activity page, view the status of the execution of the job and steps in the deployment procedure. Click the Status link for each step to view the details of the execution of each step. One can click Debug to set the logging level to Debug and click Stop to stop the procedure execution.


9. Once the procedure is successful, goto Targets->Middleware and see the newly created wls domain target.

Monday, November 19, 2012

EM12c: How to deploy JVMD agent on weblogic 12c manually?

Assumption: User has EM12cR2 with FMW 12.1.0.3 plugin

Simple option would be to deploy jamagent via Diagnostics Agent Deployment wizard. In case when deployment job fails for some reason then jamagent can be deployed manually. Instructions are given below.

1. Goto Setup Menu->Application Performance Management->Select JVM Diagnostics Engine->Click on Configure button as shown here


2. Select 'JVMs and Pools' tab on 'JVM Diagnostics Setup' page

3. Click on Download button


4. It will show you a Dialogue box that will list options to download JVMD Agent/DB Agent/JVMD Engine. Select JVMD Agent.

5. For a weblogic server, do provide the WLS server EM target name as Target Name and WLS Domain name as Pool Name. Click on Download button.


6. Download jamagent.war

7. Take this jamagent.war and deploy it via weblogic console UI.

Note: One can find more info on http://docs.oracle.com/cd/E24628_01/install.121/e24215/jvmd_using.htm#BCGCHEAG

Friday, November 09, 2012

EM12c: How to change the EM Agent Port?

The EMAgent uses a particular port to receive requests from the OMS. This port number is defined by default when one installs the EMAgent on a target host.
If one needs to modify this port at some point, one can use the following steps.

To change the EMAgent port:

1. Stop the EMAgent.
$ $AGENT_HOME/bin/emctl stop agent

2. Modify the $AGENT_HOME/sysman/config/emd.properties file in the EMAgent home directory:
    For example:
    EMD_URL=http://abc.xyz.com:3872/emd/main

    Modify the <port number> in the EMD_URL property so the EMAgent uses a new unused port on the target host.
    EMD_URL=http://abc.xyz.com:3875/emd/main

3. Start the EMAgent.
$ $AGENT_HOME/bin/emctl start agent

Note:
With this port change the target name of agent will not change on OMS side, it will still show the original port. But it will work using the new port now as given below

$ ./emctl status agent
Oracle Enterprise Manager Cloud Control 12c Release 2 
Copyright (c) 1996, 2012 Oracle Corporation.  All rights reserved.
---------------------------------------------------------------
Agent Version     : 12.1.0.2.0
OMS Version       : 12.1.0.2.0
Protocol Version  : 12.1.0.1.0
Agent Home        : /home/oracle/agent12c/agent_inst
Agent Binaries    : /home/user01/agent12c/core/12.1.0.2.0
Agent Process ID  : 5732
Parent Process ID : 5643
Agent URL         : https://abc.xyz.com:3875/emd/main/
Repository URL    : https://oms.xyz.com:4901/empbs/upload
Started at        : 2012-11-09 10:02:47
Started by user   : oracle
Last Reload       : (none)
Last successful upload                       : 2012-11-09 11:35:21
Last attempted upload                        : 2012-11-09 11:35:21
Total Megabytes of XML files uploaded so far : 0.2
Number of XML files pending upload           : 0
Size of XML files pending upload(MB)         : 0
Available disk space on upload filesystem    : 64.97%
Collection Status                            : Collections enabled
Heartbeat Status                             : Ok
Last attempted heartbeat to OMS              : 2012-11-09 11:37:11
Last successful heartbeat to OMS             : 2012-11-09 11:37:11
Next scheduled heartbeat to OMS              : 2012-11-09 11:38:11

---------------------------------------------------------------
Agent is Running and Ready

Wednesday, October 31, 2012

EM12c: Managing the Manager (MTM) with EM12cR2


With release of EM12cR2, it has MTM pages to manage the Enterprise Manager more effectively. 
These MTM pages contain monitoring and diagnostic info for the EM itself. Using these pages, one can
-view the health of EM and its various components like OMS, repository, services etc
-track the performance (notification, upload etc.)
-view diagnostics info
-manage agents

Health Overview Page
Select Setup ->Manage Cloud Control-> Health Overview


All major areas of Enterprise Manager are shown here. It has:
Overview: Provides key information for active Management Services such as the Management Agents, the WebLogic Administration Server, total number of monitored targets, number of administrators, and server load balancer (SLB) upload and console URLs, provided SLB is configured. If configured, the SLB upload and console URLs are also displayed.

Repository Details: Provides physical information about the Management Repository and the host on which the database is located. You can drill down into the database home page for more information and carry out administrative operations.

Job System Status: Displays key operational parameters of the Enterprise Manager Job service. For detailed information, you can click on the status icon to drill down into the Enterprise Manager Job Service home page.

Console Activity: Displays the overall load on the Enterprise Manager console through the average number of requests per minute and the average time required to process those requests.

Alerts: Provides details on the metric errors recorded and when an alert was triggered. In-context links to Incident Manager are also provided.

Performance Charts: Upload Backlog and Upload Rate, Backoff Requests, Notification backlog. One can drill down into any chart to view detailed metric information.

One can also see diagnostics metrics.

Repository Page
Select Setup ->Manage Cloud Control->Repository

The Repository page provides you with an overview of the status and performance of the Repository DBMS Jobs that handle part of EM’s maintenance and monitoring functionality. These DBMS jobs run within the Management Repository and require no user input. Charts showing the key Repository Details and Backlog in Repository Collection are provided. The Scheduler Status region provides the status of the scheduler and the number of Job Queue Processes.

From the Repository Details region, one can expand Management Service Repository Sessions details to view the exact number of repository connections per individual Enterprise Manager sub-component such as the event system, console, job system, or connector framework.

The Repository Scheduler Jobs Status region provides details of the DBMS Jobs regarding their status, throughput, processing time, the next scheduled run and the last scheduled run.

Advanced Queuing (AQ) provides database-integrated message queuing functionality that allows application messages to be stored persistently and propagated between queues on different machines and databases. The Management Services AQ Status region list the details of DEQUEUE and ENQUEUE status for messages specific to the Management Services AQ.


Agents Page
Select Setup -> Manage Cloud Control-> Agents.

The Agents page lists all Management Agents within your monitored environment. This page also includes misconfigured, blocked and upgradable and non- upgradable Agents.
From here one can navigate to any agent's homepage.


Management Services
Select Setup -> Manage Cloud Control->Management Services

The Management Services page displays the list of Management Services, their status, incidents, the loader throughput , CPU usage, and the JVM memory usage metrics. In addition, the Management Services displayed can be filtered by Normal Mode, Console Only, PBS only and Standby Management Services.

Viewing Enterprise Manager Topology and Charts
 To view EM topology
Select Setup-> Manage Cloud Control ->Health Overview
Select OMS and Repository menu ->Members-> Topology
The Enterprise Manager Topology page provides a graphical representation of the Enterprise Manager infrastructure components and their association. Each node in the hierarchy displays key information about the member type, the host on which it resides, and the number of incidents, if any. The incident icons on each of the nodes expand to display a global view of current status for each node in the hierarchy.

To view EM charts
Select Setup-> Manage Cloud Control ->Health Overview
Select OMS and Repository menu ->Monitoring -> Charts

The Enterprise Manager Charts page displays eight charts representing key areas that together indicate the overall health of Enterprise Manager. These are Overall Files Pending Load -Agent, Job Step Backlog, Job Step Throughput (per second), Request Processing Time (ms), Database Time (centiseconds per second), CPU Utilization (%), Pages Paged-in (per second), Pages Paged-out (per second). Data can be viewed for the Last 24 hours, last 7 days or last 31 days.

For more details, refer http://docs.oracle.com/cd/E24628_01/doc.121/e24473/mtm.htm

Friday, October 12, 2012

EM12c: How to change the password for Weblogic Admin server and Nodemanager when existing password is known and register it with emctl commands?

[Caution: If you have already configured BI Publisher, make sure to change this password with BIP as well, else it can break BIP reports.]

One can change admin server and nodemanager password from weblogic console but to ensure that emctl acknowledges this password, there are additional steps.

1. Goto admin server console of EM_GC(GCDomain) domain
https://<hostname.doaminname>:<port>/console

2. Login to Admin server console as user weblogic and its password

3. Go to Security Realms->myrealm->Users and Groups->weblogic->Passwords

4. Provide the new password and save it

5. To change the nodemanager password, follow given steps:

In case of multiple OMS Setup, steps a and b need to be executed only on the OMS server where Admin server is running.

    a.Go to GCDomain->Security(In the right section) ->Advanced

    b.Enter the new password in the "NodeManager Password" and "Confirm NodeManager Password" fields

6.Click on 'Activate Changes' in the left section

7.Stop the OMS
$<OMS_HOME>/bin/emctl stop oms -all

Stop the Agent on OMS Host
$<AGENT_HOME>/bin/emctl stop agent

8. Modify the boot.properties file of the Admin Server
($DOMAIN_HOME/servers/EMGC_ADMINSERVER/security/boot.properties):
In the above file you will see encrypted values for username and password properties. Change the password value to the new password set(clear text).
After modifying the file, it should look like:
==============================================
username={AES}pyu0QhTe6+Xpk+OjEw7vy55OudlxwDXrftY7Pbm95qA=
password=<new_passwd_in_cleartext>
==============================================

9. Modify the boot.properties file of the Managed Server
($DOMAIN_HOME/servers/EMGC_OMS1/data/nodemanager/boot.properties):
(In case of multiple OMS Setup this step need to be performed on each OMS server)
In the above file you will see encrypted values for username and password properties. Change the password value to the new password set(clear text).
After modifying the file, it should look like:
================================================
TrustKeyStore=DemoTrust
username={AES}pyu0QhTe6+Xpk+OjEw7vy55OudlxwDXrftY7Pbm95qA=
password=<new_password_in_clear_text>
================================================

10.Edit the nm_password.properties file under
<gc_inst>/user_projects/domains/GCDomain/config/nodemanager/nm_password.properties
(In case of multiple OMS Setup, this step need to be performed on each OMS server)

Change
================================================
hashed=Qg8bEYV0uA7xJiPclZO0YY1e5rk\=
================================================
to
================================================
password=<new_nodemanager_password>
username=nodemanager
================================================

11.Run following command to save the new passwords to EM Credential store
$<OMS_ORACLE_HOME>/bin/emctl secure create_admin_creds_wallet -admin_pwd <weblogic_pwd> -nodemgr_pwd <node_manager_pwd>


12.Start the OMS
$<OMS_ORACLE_HOME>/bin/emctl start oms

Sunday, September 30, 2012

EM12c: How to fix 'Job Purge' repository scheduler job when it shows as down, though its up (EM12cR2 upgrade issue)

Issue: After upgrading EM from BP1 to EM12cR2, EM reports 'Job Purge' repository scheduler job as down though it's actually up.

One can see the status of this Job, on the Repository page (Setup -> Manage Cloud Control -> Repository), in the Repository Scheduler Jobs Status section, the "Job Purge" job is shown as down with a red arrow and blanks for both Next Scheduled Run and Last Scheduled Run. All the other jobs look good and are running successfully.


Action:
Please run the following SQL as SYSMAN to correct the problem.

UPDATE MGMT_PERFORMANCE_NAMES SET display_name = NULL,
   dbms_jobname = NULL, is_dbmsjob = 'N', is_deleted = 'Y'
  WHERE UPPER(DBMS_JOBNAME) LIKE 'MGMT_JOB_ENGINE.APPLY_PURGE_POLICIES%';
COMMIT;

Now it should look like as given below:

Note: One can also refer to discussion at this Oracle forum or this blog

Friday, September 21, 2012

EM12c: How to discover a standalone OHS (Oracle HTTP Server)?


OHS(Oracle HTTP Server) can be discovered and monitored in EM12c. If an OHS is part of weblogic domain, it gets discovered during Weblogic Farm/domain discovery and monitoring automatically starts for that OHS. Details of metrics collected for an OHS that is part of weblogic domain can be found here.

However, if one has a standalone OHS. Its discovery and monitoring is bit different. Steps for discovering standalone OHS are given later in the article. One has to be aware that even after discovery of standalone OHS, all one gets is availability status metric for OHS. No other metrics are collected for standalone OHS.
Here are the steps to discover standalone OHS.

1. Go to Setup> Add Targets > Add Targets Manually
2. select Add Non-Host Targets by Specifying Target Monitoring Properties,
3. select Target Type as Oracle HTTP Server and the Monitoring Agent,
4. on the next page you will need to add the properties for OHS

Target Name - For example "Oracle_WT1"
Machine Name - fully qualified host name like "abc.xyz.com"
Oracle Home Path - /u01/Oracle/Middleware/Oracle_WT1
EM Target Type - oracle_apache
Port Number - 7777  (based on the opmnctl status -l  output ), 7777 is the default http port for OHS
Version of Apache Server - 2.2

There are many other mandatory fields, which are relevant only when OHS is registered with weblogic and can be ignored for standalone OHS discovery. So one can provide dummy values for them(e.g. "na"). These values are not used. Example is
given in following screenshot.

Tuesday, September 18, 2012

EM12c: Some interesting new features in Middleware Management with EM 12c R2(12.1.0.2) ?

With EM12c R2, FMW plugin version 12.1.0.3 has been released. With this release lot of new features have been introduced under Middleware Management and Application Performance Management areas. One can find complete list of features on MW mgmt and APM links.

Out of all features, I find following features somewhat more interesting:
1.    Business Application - A new target has been added called as Business Application target. This target combines capabilities of RUEI+BTM+JVM+ADP. The BA is associated with a system target, RUEI applications and Business Transactions.
The BA target enables a user to see and understands the health of the business application. The target represents a holistic view of the monitored application. It has its own dashboard.
Business Application has
•    Business Application Target
•    Business Application Dashboard
•    Business Applications List Page
•    Drill-down from Request Instance Diagnostics to RUEI Session Diagnostics
•    BTM Transaction to EMCC Target Association
•    Business Application Creation Wizard
•    Experience Monitoring in the Business Application Dashboard

For more details on Business Applications, click here.
Click here for demo.

2.    MWaaS (MiddleWare as a Service) – EM12cR2 cloud management has been enhanced for providing MiddleWare services along with IaaS and DBaaS. It allows administrators to create, monitor and manage a private or public MWaaS environment. MWaaS has a complete runtime env. comprised of all services necessary to deploy and run an enterprise-class java-j2ee application, including services such as application hosting, persistence store, application integration and APIs that enable programmatic access to additional computing services that might be required by an application.

MiddleWare as a Service has
•    Resource Pool
•    MWaaS Quotas
•    MWaaS Request Settings
•    Service Templates
•    Provision and De-provision Service Instance
•    Manage Application Lifecycle
•    Service Instance Scaling
•    Manage Data Sources

For more details on MWaaS, click here.

3.    Exalogic management enhancements – With EM12cR2 and Ops center, now one can see Exalogic Schematic views and manage Exalogic boxes well. These enhancements are:
•    Integrated hardware and software schematics
•    Hardware-software topology views
•    Hardware targets monitoring (Compute, ZFA appliance, Infiniband Fabric, ILOM)
•    OTD monitoring
•    Support for virtual and non-virtual configurations
•    Monitoring of Exalogic vServer guest VMs
•    Health checks
•    Trusted partition/vCPU licensing report
Click here for demo.

4.    Service Target Dashboard - With this new feature, administrators can quickly create "out of box" overviews of the health of related services. They can create templates that contain a group of services selected from the defined services in Enterprise Manager. Any Enterprise Manager user can use these defined dashboards to quickly correlate the health of services, the status of key metrics, incidents and related status of the service level agreements tied to the service.
For more details, see this demo .

Thursday, September 13, 2012

EM12c: Enterprise Manager Cloud Control 12c Release 2 (12.1.0.2) Now Available!

Oracle Enterprise Manager Cloud Control 12c Release 2 (12.1.0.2) is now available on OTN on ALL platforms. Highlight of this release is simultaneous release of EM12c R2 on all platforms. This is primarily a stability release which incorporates many of issues and feedback reported by early adopters. In addition, this release contains many new features and enhancements in areas across the board.
New Capabilities and Features
  • Enhanced management capabilities for enterprise private clouds:
    • Introduces new capabilities to allow customers to build and manage a Java Platform-as-a-Service (PaaS) cloud based on Oracle Weblogic Server. The new capabilities include guided set up of PaaS Cloud, self-service provisioning, automatic scale out and metering and chargeback.
    • Enhanced lifecycle management capabilities for Oracle WebLogic Server environments: Combining in-context multiple domain, patching and configuration file synchronizations.
    • Integrated Hardware-Software management for Oracle Exalogic Elastic Cloud through features such as rack schematics visualization and integrated monitoring of all hardware and software components.
  • The latest management capabilities for business-critical applications include:
    • Business Application Management: A new Business Application (BA) target type and dashboard with flexible definitions provides a logical view of an application’s business transactions, end-user experiences and the cloud infrastructure the monitored application is running on.
    • Enhanced User Experience Reporting: Oracle Real User Experience Insight has been enhanced to provide reporting capabilities on client-side issues for applications running in the cloud and has been more tightly coupled with Oracle Business Transaction Management to help ensure that real-time user experience and transaction tracing data is provided to users in context.
  • Several key improvements address ease of administration, reporting and extensibility for massively scalable cloud environments including dynamic groups, self-updateable monitoring templates, bulk operations against many events, etc.
New and Revised Plug-Ins:
Several plug-Ins have been updated as a part of this release resulting in either new versions or revisions. Revised plug-ins contain only bug-fixes and while new plug-ins incorporate both bug fixes as well as new functionality.
Plug-In Name Version
Enterprise Manager for Oracle Database 12.1.0.2 (revision)
Enterprise Manager for Oracle Fusion Middleware 12.1.0.3 (new)
Enterprise Manager for Chargeback and Capacity Planning 12.1.0.3 (new)
Enterprise Manager for Oracle Fusion Applications 12.1.0.3 (new)
Enterprise Manager for Oracle Virtualization 12.1.0.3 (new)
Enterprise Manager for Oracle Exadata 12.1.0.3 (new)
Enterprise Manager for Oracle Cloud 12.1.0.4 (new)

Installation and Upgrade:
  • All major platforms have been released simultaneously (Linux 32 / 64 bit, Solaris (SPARC), Solaris x86-64, IBM AIX 64-bit, and Windows x86-64 (64-bit) )
  • Enterprise Manager 12.1.0.2 is a complete release that includes both the EM OMS and Agent versions of 12.1.0.2.
  • Installation options available with EM 12.1.0.2: User can do fresh Install or an upgrade from versions EM 10.2.0.5, 11.1, or 12.1.0.2 ( Bundle Patch 1 not mandatory).
  • Upgrading to EM 12.1.0.2 from EM 12.1.0.1 is not a patch application (similar to Bundle Patch 1) but is achieved through a 1-system upgrade.
Documentation:

Customer Webcast - EM 12c Installation and Upgrade: This webcast is for customers who are interested in learning how to successfully deploy or upgrade to EM 12.1.0.2.
Enterprise Manager 12c R2 Resources:

Thursday, September 06, 2012

EM12c: How to reset the OEM Session timeout (Login timeout)?


As per EM 12c, there are following OMS properties that can influence session time out:
1. oracle.sysman.eml.maxInactiveTime
This property is used for the UI to time out a logged in user session. Default value is 45 min.
emctl utility can be used to reset this parameter.
e.g.
$ ./emctl get property -name oracle.sysman.eml.maxInactiveTime
Oracle Enterprise Manager Cloud Control 12c Release 12.1.0.1.0 
Copyright (c) 1996, 2012 Oracle Corporation.  All rights reserved.
SYSMAN password:
Value for property oracle.sysman.eml.maxInactiveTime for oms host.abc.com:4890_Management_Service is 45

$ ./emctl set property -name oracle.sysman.eml.maxInactiveTime -value 60
Oracle Enterprise Manager Cloud Control 12c Release 12.1.0.1.0 
Copyright (c) 1996, 2012 Oracle Corporation.  All rights reserved.
SYSMAN password:
Property oracle.sysman.eml.maxInactiveTime for oms host.abc.com:4890_Management_Service has been set to value 60
OMS restart is required to reflect the new property value

After resetting the oracle.sysman.eml.maxInactiveTime, do stop and start oms.
$ ./emctl stop oms

$ ./emctl start oms

2. oracle.adf.view.rich.poll.timeout
The ADF framework uses this property for UI pages that use 'polling'. Default value is 10 min.

Resetting of this property also requires OMS restart.