JVM Diagnostics has two ways of monitoring a JVM.
1. It samples JVM on a preset frequency and does monitoring 24X7.
or
2. One can actually trace JVM thread(s).
Tracing allows tracing of an active thread or tracing of All(Active) Threads inside the JVM.
For tracing, JVMD provides following options:
1. to trace all(active) threads of a JVM
Goto Targets->Middleware->JVM Diagnostics->Select specific JVM from left panel.
On right panel, from JVM dropdown, select Threads->Trace Now as given in screen shot

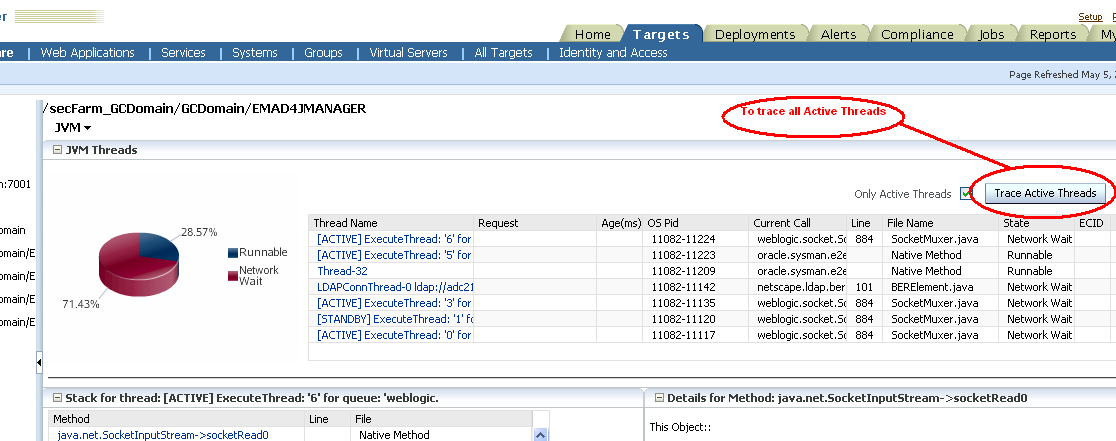
2. To trace all(active) threads of a JVM from Threads-> Real Time Analysis Page.
Goto Targets->Middleware->JVM Diagnostics->Select specific JVM from left panel.
On right panel, from JVM dropdown, select Threads->Real Time Analysis Page.
Click on 'Trace Active Threads' button as given in screen shot
3. to trace a specific thread of a JVM from Threads-> Real Time Analysis Page.
Goto Targets->Middleware->JVM Diagnostics->Select specific JVM from left panel.
On right panel, from JVM dropdown, select Threads->Real Time Analysis Page.
On right panel, from JVM dropdown, select Threads->Real Time Analysis Page.
Click on 'Trace Thread' link against the Thread Name as given in screen shot.

On selecting any of the above option, you will get page (almost similar page for all options).
Click on 'Start Trace' Button.

Once Trace is completed, you will see a message as given in next screenshot. To view the completed Trace, Click on 'Goto saved trace' link

To view all traces, Goto Targets->Middleware->JVM Diagnostics->Select specific JVM from left panel.
On right panel, from POOL/JVM dropdown, select Threads->Saved Traces option. It will show all saved traces like below.

Click on Samples, to view the trace details.
In next article, I will try to explain how to view these Traces.
No comments:
Post a Comment