1. As mentioned in previous article(http://neelimabawa.blogspot.com/2011/05/how-to-trace-threads-in-jvm-using-emgc.html), One can view JVM thread trace via
Targets->Middleware->JVM Diagnostics->Select specific JVM from left panel.
On right panel, from POOL/JVM dropdown, select Threads->Saved Traces option. It will show all saved traces. Select any trace, it will show trace details.
2. Basically trace shows the details of all the threads.

Trace shows following tables:
a. JVM Trace Details like JVM name, Threads, CPU, HeapSize, StartDate, Duration, Samples, Description, Filetrs like
Request, Method, JVM (thread) State.
b. Resource Usage - includes % CPU , Garbage Collection info, %Heap Usage, GC Time(ms)
c. Top States
d. Top Methods
e. Threads by State
f. Requests By State
g. Methods by State
3. Threads by State shows JVM threads in various activities/waits.

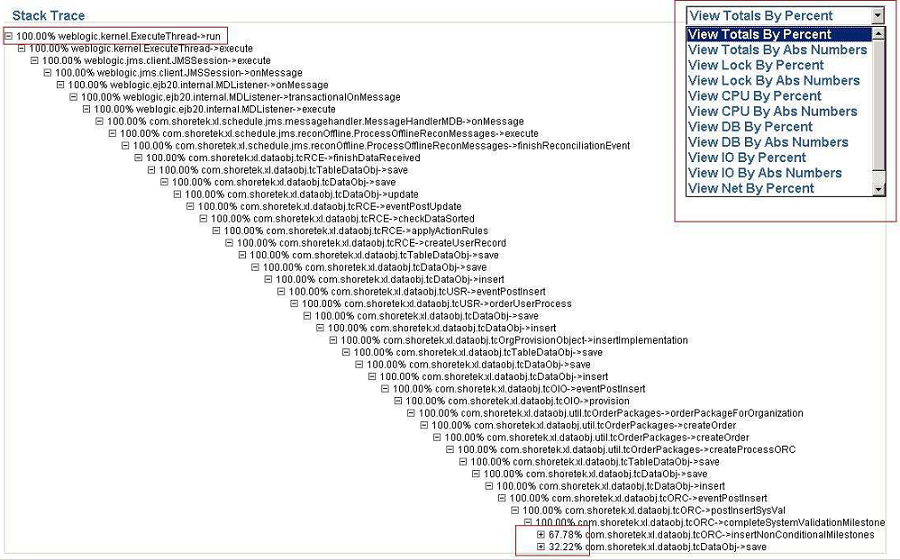
4. If one clicks on a specific thread in Threads by State table, one can see the Stack Trace on top of the page.

Expand the stack trace to see the breakdown resource waits by method.
One can narrow the search by selecting the “Percent”/“Abs Numbers” to view the exact state and the time
spent in various methods.
Targets->Middleware->JVM Diagnostics->Select specific JVM from left panel.
On right panel, from POOL/JVM dropdown, select Threads->Saved Traces option. It will show all saved traces. Select any trace, it will show trace details.
2. Basically trace shows the details of all the threads.

Trace shows following tables:
a. JVM Trace Details like JVM name, Threads, CPU, HeapSize, StartDate, Duration, Samples, Description, Filetrs like
Request, Method, JVM (thread) State.
b. Resource Usage - includes % CPU , Garbage Collection info, %Heap Usage, GC Time(ms)
c. Top States
d. Top Methods
e. Threads by State
f. Requests By State
g. Methods by State
3. Threads by State shows JVM threads in various activities/waits.

4. If one clicks on a specific thread in Threads by State table, one can see the Stack Trace on top of the page.
Expand the stack trace to see the breakdown resource waits by method.
One can narrow the search by selecting the “Percent”/“Abs Numbers” to view the exact state and the time
spent in various methods.
1 comment:
nice post...keep it up !!!
Narinder
Post a Comment