Tuesday, November 15, 2011

What's new in Enterprise Manager 12c Cloud Control for Middleware Management?

Enterprise Manager 12c Cloud Control focuses on cloud management, hence 'c' - cloud control.
EM has next generation architecture for its framework, OMS, agents etc. This architecture allows EM to become more modular and flexible for target management. In next few articles, we will focus on those areas one by one. Not getting into complete list of all enhancements, let’s focus on enhancements that impact middleware mgmt targets directly or indirectly.

Following is the list of those features:
1. Cloud Management

a.       Cloud Management Support - includes dynamic provisioning of applications and required resources based on service level requirements, and tracking of resource usage trends and costs etc.
b.      Schedule Server Availability for Power Management
c.       View cloud infrastructure topology along with details
d.      Consolidation planner - it helps to determine optimal server consolidation scenarios by leveraging data collected by Cloud Control against business and technical constraints. Using this capability, enterprises can reduce their capital expenditures as well their labor costs by consolidating separate databases and application servers into a smaller consolidated set of systems.
e.      Metering and chargeback - tracks the usage of business-critical resources or metrics by consuming entities and hence report costs


2. Framework Enhancements

a.       Target management of Oracle Products via Plug-ins - it means with every new version of FMW, we need newer plugin that supports new FMW.
b.      Personalization Support for target home pages
c.       User interface has been enhanced for global searches, menu etc.
d.      EM Agent Enhancements - monitoring and managing emagents, patching, support, debugging, group deployment of agents is made easier.
e.      New credential model integration with job system and deployment procedures - can be used to customize DPs with security
f.        Compliance management including recommendations of targets and systems with respect to business best practices for configuration, security and storage.
g.       Along with lot of new out of box reports, integration is provided with Oracle Business Intelligence (BI) Publisher.
h.      Enforced Security for Web Services
i.         Bulk Provisioning/De-provisioning of External Accounts e.g. LDAP servers, authentication enhancements like LDAP, Kerberos, SSL, PKI authentication etc.
j.        Fine-grained Privileges - more than 200 new granular privileges, new out-of-box roles have been introduced.
k.       Administration Groups to manage many targets as a single entity. This feature enables automatic deployment of monitoring settings and compliance standard settings across all targets in a group, simplifying the deployment process across large enterprises.
l.         Monitoring templates integration, blackout enhancements, MTM (monitor the monitor) improved EM diagnosis support for oms/agent etc.

3. Incident Management Features

a.       Incident manager has been introduced in 12c. It helps in managing events, incidents and problems within the infrastructure detected by EM.
b.      Incident rules enable the automation of business and operational processes as they relate to the management of events, incidents and problems. The feature includes a complete set of out-of-box rules for auto-creating incidents for important events.
c.       Incident framework integrates the job and provisioning framework.
d.      Automatic Target Discovery
e.      Out-of-Box systems feature supports discovery of Oracle-provided systems as a single entity. The user-defined systems feature enables one to model and monitor application system infrastructure in EM by creating systems targets.
f.        Metrics Enhancements - can be used for middleware targets also.
g.       User Notification Enhancements e.g. which events to be delivered via what notification method using a particular priority
h.      Availability events enhancements


4. My Oracle Support Integration

a.       One can monitor, update and create service requests on My Oracle Support.
b.      View Patch Recommendations for complete environment.

5. Fusion Middleware Management Features

a.       Topology views of FMW environment e.g. single SOA composite, Oracle WebLogic domain, or multiple Oracle WebLogic domains.
b.      Oracle Exalogic Management Plug-in supports full management capabilities with dedicated dashboards for Oracle Exalogic Elastic Cloud targets, allowing administrators to easily monitor and manage Exalogic hosts, WebLogic Server domains, application deployments and Coherence clusters running on Exalogic machines.
c.       FMW provisioning enhancements to view, create, edit, and track activity for FMW provisioning profiles and deployment procedures. Support for creating software library entities for Fusion Middleware software is now available. One can create a provisioning profile entity with binaries and domain configuration or a middleware home entity with just binaries. One can clone a WebLogic domain or Middleware home from software library entities. There is a new out-of-box deployment procedure for deploying, re-deploying and un-deploying Java EE applications from the Cloud Control console. One can now access provisioning operations from the WebLogic domain menu. One can clone and scale out/up WebLogic domains without requiring that SOA Suite be installed to the domain.
d.      Oracle Directory Server enterprise edition monitoring includes performance monitoring for Oracle Directory Server Enterprise Edition (formerly Sun Java Directory Server Enterprise Edition). The system collects a wide range of out-of-box performance metrics for monitored Oracle Directory Server Enterprise Edition targets.
e.      PaaS and IaaS environment enhancements allows a PaaS (Platform-as-a-Service) user to request an environment with a WebLogic Server cluster and to allow the user to make additional requests to scale out the requested environment. This update also allows an IaaS (Infrastructure-as-a-Service) user to request an environment with two Linux servers and storage and to allow additional requests for more storage to be submitted.
f.        SOA and Support Workbench - SOA Infrastructure target type now has a Support Workbench capability.
g.       Performance summary baseline support -one can create a performance summary baseline for a middleware-related target, save it, and compare baseline performance data against current performance data.
h.      Composite application dashboard allows a comprehensive view to be built representing a multi-tier composite application composed of multiple application deployments and Services Oriented Architecture (SOA) composites. One can easily include all additional components (such as databases, service buses, Coherence clusters, and other middleware and non-middleware targets). The Composite Application dashboard provides full visibility across the composite application with access to key monitoring and diagnostics regions, which can be easily customized and personalized. The overall result of this enhancement is a single dashboard view providing not only health information about the application, but also deeper visibility into component health and incidents at a glance.
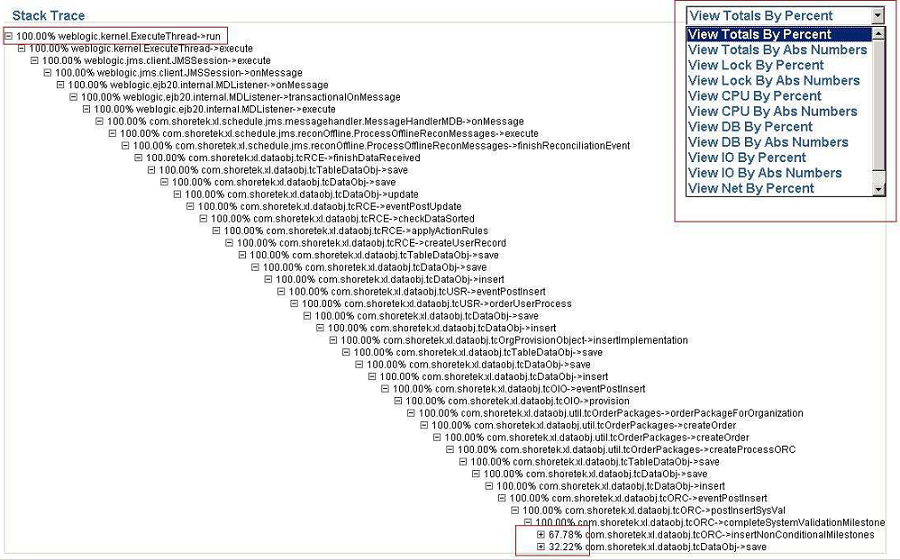
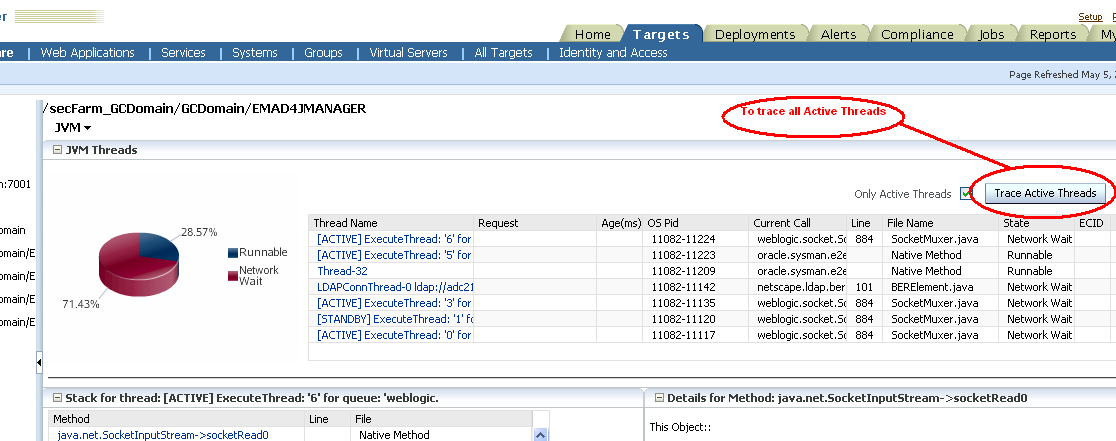
i.         Java Virtual Machine (JVM) Monitoring and Diagnostics Enhancements include a broad range of capabilities related to ease of use, greater flexibility, and deeper visibility. Most significant, all JVMs are now managed as EM targets. Users have more granular control over their settings, access, and flexibility with respect to the new personalization features for including JVM metrics in other dashboards such as the new Composite Application dashboard. The new JVM home page allows users to quickly enable deep JVM monitoring and drill into heap analysis, live threads, and overall JVM health metrics related to CPU utilization, garbage collection, thread state, and heap consumption. Filters can be deployed with a simple click allowing the JVM to be analyzed by method, request, thread state, database, database state, SQL calls, and even ECID monitoring to isolate transactions. Users now can navigate bi-directionally between live JVM threads and database sessions with the correlation between JVM thread analysis and database diagnostics, enabling DBAs and developers to collaborate in diagnosing cross-tier issues.
j.        Service Level Agreement (SLA) Management enhancements in EM ensure that it is flexible enough to represent any SLA in an environment. This feature provides a hierarchical SLA framework where Service Level Indicators (SLIs) represent key metrics and Service Level Objectives (SLOs) tie those SLIs together to define service level thresholds and requirements. SLAs use SLOs to define how the business requirements and associated notifications tie in to the overall monitoring service level framework. Using this arrangement, administrators and operations can now represent any SLA required within their environment in a manner that represents both their business and technical requirements.
k.       Enterprise-Wide Web Service Policy Dashboard - If one uses Oracle Web Services Manager for security, one can monitor all policies across the enterprise in a single central dashboard. From there, one can drill down into the specifics of any violation on each server.
l.         Middleware Diagnostic Advisor is a new tool to help administrators quickly resolve performance issues. The Middleware Diagnostic Advisor de-emphasizes administrator expertise in WebLogic internals and cross-tier functioning by taking advantage of WebLogic Server internal metrics. The Middleware Diagnostic Advisor significantly reduces problem resolution time by presenting "root cause" findings shown in context of the most relevant configuration parameters and by offering out-of-box suggestions for each finding. Trending and correlation metrics help administrators understand performance patterns and assist with diagnosing and resolving performance issues.
m.    WebLogic and FMW Log Viewer enables users to centrally search logs generated by WebLogic and Oracle Fusion Middleware across all Oracle Fusion Middleware components. One can perform structured log searches based on log properties such as time, severity or Execution Context ID (ECID). One can also download log files or export messages to a file. This feature provides ready access to log files no matter where they are stored on the file system.
n.      Configuration Comparison Enhancements to the compare functionality include new capabilities such as template support, system level comparison, and change notification. Administrators can now selectively include or ignore types of differences. Output of a compare can easily be saved and exported, both in printable (for example, plain text) and data-centric (for example, CSV) formats. Administrators can select comparison start and end dates and view a history of changes for composite targets.
o.      Configuration Search Enhancements allows administrators to search configuration attributes within an Oracle FMW target (such as the Oracle WebLogic Server) as well as follow relationships to other targets. In addition, administrators can also now create and save user-defined searches.
p.      Configuration Compliance Enhancements - The former BEA Guardian product's health checks have been integrated into the Cloud Control console. Consequently, administrators are better able to verify that their WebLogic environment is in compliance with these standards.

6. Application Performance Management Features
a.       Java Virtual Machine (JVM) Diagnostic Integration with Automatic Database Diagnostic Monitor (ADDM) provides seamless navigation between the JVMD and ADDM to allow users to maintain context when dealing with JVM issues that correlate with database calls. By providing database administrators true cross-tier navigation, they can quickly resolve SQL issues that arise from Java applications by tracing issues directly from the JVM.
b.      Application Replay allows one to capture real application level workload from a production system for a specific time segment and re-run it in a test environment. This feature enables changes in application infrastructure including mid-tier, database, operating system, and hardware to be tested and analyzed using real production application workloads.
c.       Simplified Middleware Diagnostics Deployment and Configuration simplifies the process of enabling Middleware diagnostic features such as JVM Diagnostics and Application Dependency and Performance (ADP). In the past, these components were deployed via manual, time-consuming, error prone installation processes. Now, managers and agents for both JVM Diagnostics and Application Dependency and Performance can be deployed and configured from the EM Cloud Control console interface.
d.      Application Data Model provides a comprehensive repository of application data attributes, including referential relationships and sensitive data. The model allows application owners to track, store, and report critical metadata about their applications, which simplifies and automates application data management tasks such as data sub-setting and data masking.
e.      Data Comparison - In most application life cycle processes, enterprises maintain separate test, staging and production systems. Over time, system changes may introduce differences in application data. To detect differences and to troubleshoot problems, administrators, application developers, and application managers can use data comparisons to easily detect and rectify application problems caused by missing or extraneous data, or by variances in data.
f.        Workload and Test Management Console enables users to capture data such as real application workload, to author performance test scenarios and to conduct test trials. This data can be used to keep track of trial history, view and compare test results, and perform in-depth application performance diagnostics.
g.       Dashboard and Reporting Enhancements - A new Service Level Agreement (SLA) modeling and reporting solution is now available. With Services and Support gaining focus, this solution is one of the key parts to a successful integration model. A key aspect of the model is the ability to define and monitor SLAs. A new dashboard feature allows users to create a composite application consisting of related middleware and database targets that are loosely coupled together to provide concrete business functionality.
h.      Diagnostic Snapshot Support captures both Oracle WebLogic Server and Java Virtual Machine (JVM) data and packages it for later analysis. The feature displays a page of diagnostic snapshots that can be imported into and exported out of EM, allowing much more flexibility with respect to when and where one analyzes the data. Should a similar situation arise, the diagnostic snapshot can be preserved to allow for later analysis and comparison. Also, diagnostic snapshots can be shared with Oracle Support to ensure that Oracle can better assist in critical issues where additional support is needed. If one combines this feature with the WebLogic Support Workbench that was introduced in the previous release, EM truly is integrated deeply into the My Oracle Support Portal and Oracle Support in general to streamline support and the exchange of information necessary to resolve issues quickly.
a.       SOA Dehydration Store Diagnostics has a dedicated view to analyze the behavior of the SOA dehydration database. In particular, one can monitor SQL performance metrics and table growth specifically in the context of the SOA Suite's use of the database. The view displays both throughput and wait bottleneck data, allowing one to monitor the general health of the target database instance. Using Active Session History, one can track usage data and display it as a table space chart, a growth rate chart, or an execution chart.
a.Accurate CPU performance data is vital to properly administer ones SOA applications.

Tuesday, September 20, 2011

How to create an OS script based UDM to calculate “Network Packet Loss”?


To create OS script based UDM, following steps are needed:
1. Create the OS script
2. Create an OS script based UDM

Let’s look at these steps in detail:
1. Create the OS script (For details, look at http://download.oracle.com/docs/cd/E11857_01/em.111/e16790/udm.htm#CGDBACGA)
OS script can be created using any scripting language e.g. perl/shell scripting etc.
I have created a shell script (npl.sh) to calculate 'Network Packet Loss' as given below
================================================
#!/bin/sh
# Sample User Defined Event monitoring script.
export PATH="/bin:/usr/bin:/usr/sbin";
cmd=`mtr -c 1 -r`;

p=`echo $cmd|cut -d " " -f 9|cut -d '%' -f 1`

echo "em_result=${p}";
echo "em_message=Network Packet Loss is: ${p}"
================================================

You can create this script (npl.sh) at any location like in my case, I saved it as /u01/scripts/npl.sh
Ensure that you can run the script once as the required user and it should give you expected output on command prompt itself before you register the script for UDM.

This script uses "mtr" command that requires SUDO access, so I need to execute an additional step to ensure that SUDO access is given to the user while running this script. That additional step is to configure Privilege Delegation Providers (http://download.oracle.com/docs/cd/E11857_01/install.111/e16847/addnl_tasks.htm#BABDEADD)

Creating a Privilege Delegation Setting
a. Click on Setup link on the Enterprise Manager home page and then choose Manage Privilege Delegation Settings from the left menu panel.
b. It will show you list of target hosts. Click on Edit button against the target host where you want to run the script.
c. Select the SUDO privilege delegation type
d. Enter the privilege delegation command e.g. I entered "sudo -u %RUNAS% %COMMAND%" and click on Update to apply the settings to the host.
e. Confirm the setting

2. Create an OS script based UDM
Now that we have created the script (npl.sh), configured needed privilege and ensured that script g ves expected output. Next step is to register the script for UDM and create the UDM

a. From the home page of the target Host that has OS monitoring script (npl.sh), choose User-Defined Metrics link from Related Links at the page bottom. The User-Defined Metrics summary page appears.

b. Click Create.

Enter the Metric Name as "network_packet_loss"
Metric Type as Number
Command Line "/bin/sh /u01/scripts/npl.sh"
Provide Operating System Credentials to run the script. Do ensure to select Run Privilege as "Sudo" and Run as root"

Enter Thresholds
For Comparison Operator ">=" Warning as "5" and Critical as "10"

Let other values be default values for Consecutive Occurrences or Schedule etc.
By default, metric evaluation will happen every 5 minutes.

c. Click OK.
"network_packet_loss" metric is created and will appear in the User-Defined Metric summary page.

After 5 min. , you should start seeing data/charts against this user defined metric.

Thursday, September 01, 2011

EM11g ADP: How to resolve NoClassDefFoundError: oracle/adf/model/portlet/binding/PortletBinding error?

Problem: ADP manager is configured and setup successfully. ADP agent has been deployed successfully on 10.3.3 managed server. 10.3.3 WLS server has some ADF applications. After deploying adp agent, managed server comes up with following error in its log:
Root cause of ServletException.
java.lang.NoClassDefFoundError: oracle/adf/model/portlet/binding/PortletBinding
         at oracle.adfinternal.controller.engine.ControlFlowEngine.invokeTaskFlow(ControlFlowEngine.java:1)
         at oracle.adfinternal.controller.state.ChildViewPortContextImpl.invokeTaskFlow(ChildViewPortContextImpl.java:102)
         at oracle.adfinternal.controller.state.ControllerState.createChildViewPort(ControllerState.java:1302)
         at oracle.adfinternal.controller.ControllerContextImpl.createChildViewPort(ControllerContextImpl.java:76)
         at oracle.adf.controller.internal.binding.DCTaskFlowBinding.createRegionViewPortContext(DCTaskFlowBinding.java:409)
         at oracle.adf.controller.internal.binding.DCTaskFlowBinding.getViewPort(DCTaskFlowBinding.java:332)
         at oracle.adf.controller.internal.binding.TaskFlowRegionModel.doProcessBeginRegion(TaskFlowRegionModel.java:160)
         at oracle.adf.controller.internal.binding.TaskFlowRegionModel.processBeginRegion(TaskFlowRegionModel.java:108)
         at oracle.adf.controller.internal.binding.TaskFlowRegionController.doRegionRefresh(TaskFlowRegionController.java:197)
         at oracle.adf.controller.internal.binding.TaskFlowRegionController.refreshRegion(TaskFlowRegionController.java:119)

Solution: Add "–Xverify:none" to the JVM startup arguments

Cause: "–Xverify:none" JVM option turns off the class verifier.

Friday, August 19, 2011

How to configured mail Alerts in OEM 11g for WebLogic Servers up/down status?

To setup mail alerts in OEM 11g,

1. First step would be to set the Notification Methods.
Goto Setup (On Right top of OEM UI)->Notification Methods (On left Panel).
It should give you page to setup Mail Server for notifications
--------------------------------------------------
Outgoing Mail (SMTP) Server - smtp.mycorp.com
User Name                   - myadmin
Password                    - ******
Confirm Password            - ******
Identify Sender As          - Enterprise Manager
Sender's E-mail Address     - myadmin@mycorp.com
Use Secure Connection       - No : E-mail is not encrypted.
                              SSL: E-mail is encrypted using the Secure Sockets Layer protocol.
                              TLS, if available: E-mail is encrypted using the Transport Layer Security protocol if the mail server supports TLS. If the server does not support TLS, the e-mail is automatically sent as plain text.
--------------------------------------------------

2. Second step would be to setup email for an OEM user
To receive email notification, specify email address(s) on Preference page.
Goto Preferences (On Right top of OEM UI)->General (On left Panel).
Add email address(s) and Test it(them).

3. Third step is to select a Notification Schedule [Optional for this usecase]
Goto Preferences (On Right top of OEM UI)->Notification Schedule(On left Panel).
By default, for the first time, 24x7 weekly notification schedule is set automatically.
A notification schedule is a repeating schedule used to specify your on-call schedule—the days and time periods and e-mail addresses that should be used by Enterprise Manager to send notifications to you. Each administrator has exactly one notification schedule.

4. Fourth step is to create a Notification Rule for WebLogic Domains/Servers and subscribe to it, to receive an e-mail
A notification rule is a user-defined rule that defines the criteria by which notifications should be sent for alerts, policy violations, corrective action, execution status and job execution status.

a. Goto Preferences (On Right top of OEM UI)->Notification-> Rules(On left Panel). [For a super administrator, it will be display Rules while for a normal administrator, it will be My Rules]

b. Click Create button.
It will display "Create Notification Rule" pages. Enter the required information on each page to create your notification rule.

e.g. In General tab, Provide rule
-name as "WebLogic Server Availability and Critical States"
-Description as "WebLogic Server Availability and Critical States"
-Select 'Make Public' check box
-Select 'Target Type' as "Oracle Weblogic Server"
-Select appropriate radio button to apply rule to all Weblogic Servers or selective Weblogic Servers.
In our case, lets select 'Apply rule to all Oracle WebLogic Server targets' radio button.

On Availability tab,
Select 'Up' and 'Down' Checkboxes (and any other status that you are interested in)

If you have chosen any metrics, then add those metrics under Metrics tab.
One can add policies/jobs via Policies/Jobs tabs.

On Actions tab,
Select 'E-mail Notification', 'Send Me E-mail' checkbox.

Select OK Button.

Note: Notification rules allow you to choose the targets and conditions for which you want to receive notifications from Enterprise Manager. These notifications include e-mail, SNMP traps and running custom scripts.

For more details about various Notification options and Out of Box rules etc., pl refer
http://download.oracle.com/docs/cd/E11857_01/em.111/e16790/notification.htm#autoId7

http://download.oracle.com/docs/cd/E11857_01/em.111/e16790/notification.htm#autoId7

Friday, July 22, 2011

Where can I find the most common log files for Middleware (including FMW, ADP, JVMD) monitoring?

While working on middleware (including OEM/FMW/ADP/JVMD) monitoring, when I run into an issue, I need to access logs. OEM logs can be found at various locations. Different components do logging in different files.
As per OEM documentation, there are various log files (documented at

The most common log files that I often access are:

OMS logs
OMS logs can be found in various directories and all contain information respective to that tier.

1. OMS logs are under
<EM_INSTANCE_BASE>/em/<OMS_NAME>/sysman/log
e.g. /u01/app/oracle/gc_inst/em/EMGC_OMS1/sysman/log

a. emoms.trc – this is most important trace file that contains oms actions and errors.
b. emoms.log - It has oms starting/stopping/any error when it generates an error.
c. emctl.log - emctl commands are logged in this file

2. Weblogic Server - Since em application run inside weblogic server. So these logs are often very important and contain useful info.
<EM_INSTANCE_BASE>/user_projects/domains/<domain_name>/servers/<SERVER_NAME>/logs/<SERVER_NAME>.out
e.g.
/u01/app/oracle/gc_inst/user_projects/domains/GCDomain/servers/EMGC_OMS1/logs/EMGC_OMS1.out

3. WebTier logs can be found under
<EM_INSTANCE_BASE>/<webtier_instance_name>/diagnostics/logs/OHS/<ohs_name>
e.g.
/u01/app/oracle/gc_inst/WebTierIH1/diagnostics/logs/OHS/ohs1

4. OPMN log
<EM_INSTANCE_BASE>/<webtier_instance_name>/diagnostics/logs/OPMN/<opmn_name>
e.g.
/u01/app/oracle/gc_inst/WebTierIH1/diagnostics/logs/OPMN/opmn1

EMAgent logs
EMAgent logs can be found in $AGEN_HOME/sysman/log directory

a. emagent.log - Log file used by the Agent process.  Contains all informational messages in local language.
b. emagent.nohup - Log file for the Agent monitor. This contains all actions the monitor has performed.
c. emagent.trc - Trace file used by the Agent process. Contains all the trace messages in English.
d. emagent_memdump_<time>.trc - Optional trace file, generated by an 'emctl status agent memory' command. Contains the overview of the memory usage of the Agent at that point in time.
e. emagentfetchlet.log - The fetchlet log files used by the EM Agent for certain data-gathering tasks
f. emagentfetchlet.trc - The fetchlet trace file used by the EM Agent for certain data-gathering tasks.
g. emagent_perl.trc - Trace file for the PERL scripts. This includes the PERL metrics and the discovery
h. emdctl.log - Agent control utility log file
i. emdctl.trc - Agent control utility trace file

ADP logs
When ADP is registered on same OEM UI
1. ADP Manager logs
Would be present under
$ADP_HOME/log/manager-log*.csv

2. ADP Agent logs
Would be present under target Application server directory
<APPSERVER_HOME>/AcseraAgent/* and
<APPSERVER_HOME>/AcseraLogs/*

In addition to these directories, adp agent also marks its foot print in application server specific log files for deploy/undeploy/start/stop/configuration files etc.

3. ADP UI logs
<MW_HOME>/sysman/ocamm/Log/*
e.g.
/u01/app/oracle/middleware/sysman/ocamm/Log/*

JVMD logs
When JVMD is installed with OEM
1. JVMD Manager logs
<EM_INSTANCE_BASE>/user_projects/domains/<domain_name>/servers/<SERVER_NAME>/logs/<SERVER_NAME>.out
e.g.
/u01/app/oracle/gc_inst/user_projects/domains/GCDomain/servers/EMAD4JMANAGER1/logs/EMAD4JMANAGER1.out

2. JVMD Agent logs
JVMD agent logs its output on stdout. So all its logs get logged in container output file e.g. if
jamagent is deployed on OMS weblogic server, you can find jamagent logs in
<EM_INSTANCE_BASE>/user_projects/domains/<domain_name>/servers/<SERVER_NAME>/logs/<SERVER_NAME>.out
e.g.
/u01/app/oracle/gc_inst/user_projects/domains/GCDomain/servers/EMGC_OMS1/logs/EMGC_OMS1.out

3. JVMD UI logs
Some logs goto <EM_INSTANCE_BASE>/em/<OMS_NAME>/sysman/log/emoms.log
e.g. /u01/app/oracle/gc_inst/em/EMGC_OMS1/sysman/log/emoms.log

and sometimes, you will find errors under
<EM_INSTANCE_BASE>/user_projects/domains/<domain_name>/servers/<SERVER_NAME>/logs/<SERVER_NAME>.out
e.g.
/u01/app/oracle/gc_inst/user_projects/domains/GCDomain/servers/EMGC_OMS1/logs/EMGC_OMS1.out

Wednesday, July 13, 2011

How to fix "java.lang.NoClassDefFoundError: oracle/jrf/PortabilityLayerException" ?

In EMGC 11 env., while monitoring FMW targets if you encounter following Error in emagent log:
2011-07-11 02:08:37,133 [nmefmgr_getJNIFetchlet] ERROR fetchlets.FabricFetchletWrapper logp.251 - Invocation Error in Fabric Fetchlet wrapper:
java.lang.reflect.InvocationTargetException
  at sun.reflect.NativeMethodAccessorImpl.invoke0(Native Method)
  at sun.reflect.NativeMethodAccessorImpl.invoke(NativeMethodAccessorImpl.java:39)
  at sun.reflect.DelegatingMethodAccessorImpl.invoke(DelegatingMethodAccessorImpl.java:25)
  at java.lang.reflect.Method.invoke(Method.java:597)
  at oracle.sysman.emd.fetchlets.FabricFetchletWrapper.getMetric(FabricFetchletWrapper.java:109)
  at oracle.sysman.emd.fetchlets.FetchletWrapper.getMetric(FetchletWrapper.java:382)
...
Caused by: java.lang.NoClassDefFoundError: oracle/jrf/PortabilityLayerException
  at oracle.soa.management.internal.ejb.EJBLocatorImpl.lookupBean(EJBLocatorImpl.java:741)
  at oracle.soa.management.internal.ejb.EJBLocatorImpl.lookupFinderBean(EJBLocatorImpl.java:728)
  at oracle.soa.management.internal.ejb.EJBLocatorImpl.<init>(EJBLocatorImpl.java:165)
  at oracle.soa.management.facade.LocatorFactory.createLocator(LocatorFactory.java:35)
  at oracle.sysman.emd.fetchlets.FabricFetchlet.getLocator(FabricFetchlet.java:813)
  at oracle.sysman.emd.fetchlets.FabricFetchlet.getMetric(FabricFetchlet.java:194)
  ... 6 more
Caused by: java.lang.ClassNotFoundException: oracle.jrf.PortabilityLayerException
  at java.net.URLClassLoader$1.run(URLClassLoader.java:200)
  at java.security.AccessController.doPrivileged(Native Method)
  at java.net.URLClassLoader.findClass(URLClassLoader.java:188)
  at java.lang.ClassLoader.loadClass(ClassLoader.java:307)
  at java.lang.ClassLoader.loadClass(ClassLoader.java:252)
  at oracle.sysman.emd.fetchlets.thirdparty.TPJMXFetchletClassLoader.loadClass(TPJMXFetchletClassLoader.java:78)
..
Reason: This error is appearing as emagent requires "jrf-api.jar" to be present in its CLASSPATH.

A simple workaround to fix the issue is:
1. Stop the agent
2. Add following jarfile to CLASSPATH property in emd.properties of emagent
$MW_HOME/oracle_common/modules/oracle.jrf_11.1.1/jrf-api.jar
where MW_HOME is the Middleware Home of FMW target .
3. Restart the agent.

Sunday, July 03, 2011

EMGC11: JVMD Manager is deployed successfully, but UI shows manager as inactive

JVMD manager is deployed successfully.  JVMD Manager log shows that native library
is loaded. Manager get registered with EMDB. One can see that manager appears
on UI under JVM Dignostics->Setup->JVMs & Managers tab. But manager status is
shown as inactive. No data appears for any of the JVMs.

Cause: In case of JVMD, data interaction happens in two directions:
1. From JVMD manager to agent and vice versa via socket communication.
2. For real time data, EMUI calls JVMD manager via t3 calls.
Somewhere 2nd communication is broke.

Action: In case if OMS and JVMD manager are deployed on different machines
where there is a firewall between the two. Do check if t3 port is accessible
from JVMD manager machine to OMS machine. One can find related information under
emoms.log also.

Wednesday, June 22, 2011

EMGC 11g - What is Support WorkBench for FMW?

Support Workbench is a feature where, on identification of a problem, targeted diagnostics data is dumped in a well-known format and location, for further analysis by administrators, Oracle Support and development. In case of Support Workbench for FMW, this feature works for Weblogic Server Targets.

Support Workbench depends on:• JRF and incidence creation need to be enabled on Target WLS.
• a local EM agent is required on the host where target WebLogic server is running.

To use Support Workbench, pl. follow given steps:
a. Click on WLS target name where you see alerts
b. On WLS home page, click on ‘WebLogic Server’ drop down and select ‘Support Workbench’ or click on ‘Support Workbench Incidents’ as given in screenshot

c. This will take you to Support Workbench Page as given below.

d. Now if you click on incident number, it will ask for Weblogic credentials and host credentials.
e. On providing credentials, it will take you to another page where it will show various files that have been collected as part of this incident. You can view the various files and analyze them.

Wednesday, June 15, 2011

EM11g - [nmefmgr_getJNIFetchlet] WARN JMX.generic logp.251 - IOException: cannot communicate to Target with serviceURL

EMagent is deployed on target host. Target WLS is discovered.
But only the general information about WLS is visible on EMUI. Monitoring details like JDBC, applications, JMS resources etc. are all empty.

emagentfetchlet.trc contains
2011-06-16 11:54:10,211 [nmefmgr_getJNIFetchlet] WARN  JMX.generic logp.251 - IOException: cannot communicate to Target with serviceURL=service:jmx:t3://hostname:6003/jndi/weblogic.management.mbeanservers.runtime for metric weblogic_j2eeserver:server_internal:: Couldn't connect to any host Cause: javax.naming.NamingException: Couldn't connect to any host [Root exception is org.omg.CORBA.COMM_FAILURE:   vmcid: SUN  minor code: 203 completed: Maybe]

Action: Verify that Target Weblogic Server Domain->Advance settings should contain Platform MBean Server Enabled. Set 'PlatformMBeanServerEnabled' to True and restart the weblogic server.

Thursday, June 02, 2011

How to view JVMD thread trace(snapshot)?

1. As mentioned in previous article(http://neelimabawa.blogspot.com/2011/05/how-to-trace-threads-in-jvm-using-emgc.html), One can view JVM thread trace via
Targets->Middleware->JVM Diagnostics->Select specific JVM from left panel.
On right panel, from POOL/JVM dropdown, select Threads->Saved Traces option. It will show all saved traces. Select any trace, it will show trace details.

2. Basically trace shows the details of all the threads.

Trace shows following tables:
a. JVM Trace Details like JVM name, Threads, CPU, HeapSize, StartDate, Duration, Samples, Description, Filetrs like
Request, Method, JVM (thread) State.
b. Resource Usage - includes % CPU , Garbage Collection info, %Heap Usage, GC Time(ms)
c. Top States
d. Top Methods
e. Threads by State
f. Requests By State
g. Methods by State

3. Threads by State shows JVM threads in various activities/waits.


4. If one clicks on a specific thread in Threads by State table, one can see the Stack Trace on top of the page.

Expand the stack trace to see the breakdown resource waits by method.
One can narrow the search by selecting the “Percent”/“Abs Numbers” to view the exact state and the time
spent in various methods.

Thursday, May 05, 2011

How to trace thread(s) in a JVM using EMGC 11 JVM Diagnostics?

JVM Diagnostics has two ways of monitoring a JVM.
1. It samples JVM on a preset frequency and does monitoring 24X7.
or
2. One can actually trace JVM thread(s).

Tracing allows tracing of an active thread or tracing of All(Active) Threads inside the JVM.
For tracing, JVMD provides following options:

1. to trace all(active) threads of a JVM
Goto Targets->Middleware->JVM Diagnostics->Select specific JVM from left panel.
On right panel, from JVM dropdown, select Threads->Trace Now as given in screen shot


2. To trace all(active) threads of a JVM from Threads-> Real Time Analysis Page.
Goto Targets->Middleware->JVM Diagnostics->Select specific JVM from left panel.
On right panel, from JVM dropdown, select Threads->Real Time Analysis Page.
Click on 'Trace Active Threads' button as given in screen shot


3. to trace a specific thread of a JVM from Threads-> Real Time Analysis Page.
Goto Targets->Middleware->JVM Diagnostics->Select specific JVM from left panel.
On right panel, from JVM dropdown, select Threads->Real Time Analysis Page.
Click on 'Trace Thread' link against the Thread Name as given in screen shot.

On selecting any of the above option, you will get page (almost similar page for all options).
Click on 'Start Trace' Button.


Once Trace is completed, you will see a message as given in next screenshot. To view the completed Trace, Click on 'Goto saved trace' link


To view all traces, Goto Targets->Middleware->JVM Diagnostics->Select specific JVM from left panel.
On right panel, from POOL/JVM dropdown, select Threads->Saved Traces option. It will show all saved traces like below.


Click on Samples, to view the trace details.

In next article, I will try to explain how to view these Traces.