Showing posts with label EM12c. Show all posts

Saturday, June 14, 2014

EM12c: How to upgrade JVMD Engine and JVMD agents in EM12cR4?

To upgrade JVMD Engine and JVMD agents. Pls. follow steps as given:

1.    Goto Setup->Middleware Management-> Application Performance Management


 2.    Select on triangle next to JVM Diagnostics Engines


3.    This page will show already installed JVM Diagnostics Engines.  Provide credentials for the host where JVMD Engine is running and also provide credential for the Weblogic Domain (EMGC Domain), of which JVMD manager is part of. Then click on Apply button in lower panel.


4.    One all credential have been applied. Click on Upgrade button on top panel.


 5.    It will ask for confirmation if you want to upgrade JVMD engine to newer version. Click OK.


6.    That will submit an EM Job to upgrade the JVMD Engine as shown below:


7.    JVMD Engine is up and running


8.    Similar way, we can upgrade JVMD agents using given steps. Select triangle icon against JVMD Agents Count:


9.    This will show agent Upgrade Wizard. Select Upgrade option. Select agents to be upgraded.


10.    Provide credentials for the Target weblogic domain where JVMD agents are deployed. And click on Apply button in lower panel.


11.    Then select Next button on top panel.


12.     Do a final review of all input and click on Upgrade button.


13.    It will submit following EM job


14.    Once the job is successful. You will see like given screenshot.


15.     Now you can go to JVMD UI and verify that JVMD Agents have started reporting to JVMD Engine and JVMD data is there.


Wednesday, May 14, 2014

EM12c: Unable to delete Database System target successfully

Problem: Tried removing Database System target from UI, but it fails with following error in emoms.trc :

 2014-04-23 17:06:28,234 [EMUI_17_06_28_/console/rac/conf/racTargetDelete] ERROR svlt.PageHandler

handleRequest.674 - java.lang.IndexOutOfBoundsException: Index: 1, Size: 0
java.lang.IndexOutOfBoundsException: Index: 1, Size: 0
    at java.util.ArrayList.get(ArrayList.java:352)


Action: If the error continues while removing the Database system target, drop it via command line as given below:

$ cd $OMS_HOME/bin

$ ./emcli login -username=SYSMAN -password=<sysman_passwd>
 

$ ./emcli sync
 

$ ./emcli delete_target -name="<dbsys_name>" -type="oracle_dbsys"
replace <dbsys_name> with the database system target name, as shown in the All targets list.


It should remove database system target properly.

Thursday, March 20, 2014

EM12c: EMSYSTEMEXCEPTION ON UI WHILE CREATING JAVA EE APPLICATION IN SW LIBRARY

In EM 12.1.0.3, when trying to upload a J2ee Application Component to software library, it shows status as incomplete and oracle.sysman.emSDK.app.exception.EMSystemException can be seen on UI.

emoms.log shows following associated exception:
Caused by: java.sql.SQLException: ORA-20406: The following targets are invalid: em-oms.example.com
ORA-06512: at "SYSMAN.EM_JOB_OPS", line 290
ORA-06512: at "SYSMAN.GC_JOB", line 29
ORA-06512: at line 1
at oracle.jdbc.driver.T4CTTIoer.processError(T4CTTIoer.java:462)  
at oracle.jdbc.driver.T4CTTIoer.processError(T4CTTIoer.java:405)
at oracle.jdbc.driver.T4C8Oall.processError(T4C8Oall.java:931)

---
---

Cause: It turns out that if the OMS virtual host name is different from physical host name, that caused this issue.

Solution: This is a product bug, there is no fix AS OF NOW. But there is a workaround, not the best solution but to proceed further, it helps.

To workaround the issue, one can push another agent on oms host with same physical name. This will resolve the virtual host vs physical host conflict.
Now upload the J2ee Application Component to software library, it will be successful.

Once the J2ee App has been uploaded. One may stop the agent and bring it up only when its needed again. Else it can add some overhead to existing resources.

Tuesday, February 11, 2014

EM12c: Weblogic host is up, but EM doesn't show metric data (ORA-01882)

Issue: On EM12c, Weblogic Server is discovered successfully. On EM12c UI, one can see various middleware targets and their respective availbility status. But when one wants to see the details metrics like Servlets and JSPs metrics or Work Manager etc. It shows 'Unavailable' as shown in screenshot below:


Also  when one looks at emoms.log with DEBUG level on, one see following error:

2014-01-25 18:53:04,015 [53::[ACTIVE] ExecuteThread: '14' for queue: 'weblogic.kernel.Default (self-tuning)'] DEBUG as.ServerHomeDeploymentsModel logp.251 - Error getting metrics for the application deployments table
oracle.sysman.emSDK.app.exception.EMSystemException
at oracle.sysman.emas.sdk.model.metric.ReposMetricProvider12.queryMultiMetricsByAssocOneQuery(ReposMetricProvider12.java:529)
at oracle.sysman.emas.model.as.ServerHomeDeploymentsModel.setupMetricBatchProvider(ServerHomeDeploymentsModel.java:198)at oracle.sysman.emas.model.as.ServerHomeDeploymentsModel.setDeployments(ServerHomeDeploymentsModel.java:517)

Caused by:
java.sql.SQLDataException: ORA-01882: timezone region not found
ORA-06512: at "SYSMAN.MGMT_GLOBAL", line 8

at oracle.jdbc.driver.T4CTTIoer.processError(T4CTTIoer.java:462)
at oracle.jdbc.driver.T4CTTIoer.processError(T4CTTIoer.java:405)
at oracle.jdbc.driver.T4C8Oall.processError(T4C8Oall.java:931)
at oracle.jdbc.driver.T4CTTIfun.receive(T4CTTIfun.java:481)
at oracle.jdbc.driver.T4CTTIfun.doRPC(T4CTTIfun.java:205)


In this case, agent is working fine and collecting all data, passign to OMS. Where entire metric data is getting collected in EM repository. However, this is an OMS UI side issue, where due to difference in Timezone of agent and host, OMS is not showing the metric data.

Solution: Set the TimeZone before starting OMS server.
One can set timezone at OMS host at host/user level .At host level would be ideal.
Use following example to start the timezone:

%$OMS_HOME/bin/emctl stop oms
 

%export TZ=PST8PDT
 

%$OMS_HOME/bin/emctl start oms

Friday, October 18, 2013

EM12c: Service Management (Synthetic Monitoring) White Paper

Oracle EM12c cloud control provides a comprehensive monitoring solution for IT organizations to achieve high availability, performance and optimized service levels for their business services. EM's service management solution allows you to actively monitor and report on the availability and performance of a wide variety of services, including end users business functions (mail infrastructure, network and database services), web applications, Oracle Apps etc.. Using synthetic transactions one can monitor services from end users perspective.

To understand Service management, Service Definition, Service Test (using ATS), System, Service Level Agreement, Service Dashboard etc., pl refer the Service Management White Paper

http://www.oracle.com/technetwork/oem/soa-mgmt/wp-servicemanagment-em12c-2028666.pdf

Monday, July 29, 2013

EM12c: What's new in Fusion Middleware Plug-in 12.1.0.4?

With EM PS2 (12.1.0.3) release, FMW plugin 12.1.0.4 has been released.
Main features of this plugin are listed below:

SOA Management Features

Enhancements to SOA Fault Management
SOA administrators can now perform comprehensive fault management directly from Enterprise Manager Cloud Control, including search and single and bulk fault recovery. This new feature replaces all of the previous faults and reject messages tabs and regions at the composite level with the top-level search and resubmit.

RAC support for SOA Dehydration Monitoring
SOA Dehydration store monitoring in Enterprise Manager Cloud Control now supports RAC databases.

Monitoring and Diagnostics Features
Enhancements to Auto Discovery for Oracle Fusion Middleware and WebLogic DomainsManagement Agent-based auto discovery for Oracle Fusion Middleware is now enabled automatically with Oracle Enterprise Manager Cloud Control 12c. In addition, administrators who use agent-based auto discovery for Oracle Fusion Middleware are no longer required to specify the Oracle Middleware home for each host that the discovery module runs on.

Enhancements to Fusion Middleware and WebLogic Domain Discovery
When adding Fusion Middleware and WebLogic Domain targets to Enterprise Manager Cloud Control, administrators can now choose whether to discover all versions of deployed Java EE applications or just the active version of deployed applications. This provides more flexibility and control in terms of what to centrally manage and monitor from the Cloud Control console.

For each Java EE application that is discovered, a new domain application deployment target is also added. This domain application deployment target provides a single view of the application across the entire domain, rather than a more granular view at the server or cluster levels.

WebLogic Server 12.1.2 ManagementBeginning with this release, administrators are able to discover and centrally manage their WebLogic Server version 12.1.2 deployments. All existing management features continue
to be supported with WebLogic Server version 12.1.2, including:
  •     Performance management
  •     Business Transaction Management
  •     Process control
  •     Configuration management
  •     Cloning middleware and scaling up/out domain
  •     Patching

Support for Managing Oracle GlassFish Domains
Administrators can now discover and centrally manage their open source as well as commercial versions of Oracle GlassFish domains in the Oracle Enterprise Manager Cloud Control console. Management features for Oracle GlassFish include:
  •     Performance management – monitor Oracle GlassFish availability and performance out-of-box, track such data historically, and receive notifications of potential problems.
  •     Process control – submit predefined job to start, restart, or stop Oracle GlassFish components.
  •     Configuration management – perform extensive analysis (for example, search, compare, track change) against automatic, daily collections of Oracle GlassFish data.

Having a single interface for managing Oracle GlassFish software along side other data center environments such as databases and operating systems is critical to ensuring
applications are available and performing at an optimal level.
Exalytics ManagementWith the introduction of the Exalytics target, Exalytics management is now consistent with other engineered systems. Both virtual and physical deployments will be supported for
this target. The feature includes guided discovery, a personalizable software dashboard, routing topology, and vCPU usage reporting.

These features align Exalytics management with the Engineered Systems Management story and show a tighter integration between Exalytics and Enterprise Manager Cloud Control 12c.

The new features improve the user's management experience and productivity. The vCPU reporting supports the reporting and auditing requirement for virtualized environments using vCPU licensing.
JVMD/ADP Installation and UpgradeYou can now automate the deletion of JVMD/ADP engines and agents. This feature is available from the Enterprise Manager Cloud Control user interface. Previously deletion or
undeployment required manual steps.
Updates to the Middleware Summary PageThe Middleware Summary page (accessible by selecting Middleware from the Targets menu) has traditionally displayed a table with the status and health of middleware software
managed by Enterprise Manager Cloud Control.

Beginning with this release, administrators can now choose to display a graphical view of the same data. This graphical view is similar to a heat map where targets are represented as boxes and the size and color of each box depicts a potential problem areas. Such a view enables administrators to quickly analyze a large amount of data, customize filtering, and pinpoint problems more efficiently.

The Middleware Summary page also provides predefined searches that filter the target types shown in both of the table as well as graph views. The searches available are based on what middleware targets have been discovered by Enterprise Manager Cloud Control. The most recent search selected is saved as the default search to display when returning to the Middleware Summary page. Saved searches enable administrators to find what they are looking for faster.

Monitor Oracle Jolt Performance Metrics
Administrators can now monitor Oracle Jolt performance metrics including maximum capacity, pending requests, pool state, request errors (per minute), and requests (per minute).

Such metrics are available from the WebLogic Server target when Oracle Tuxedo and WebLogic are configured to use Oracle Jolt.
WebLogic Cluster Performance Summary Page Supported for Non-Oracle JRF Enabled Clusters
The WebLogic Cluster Performance Summary page no longer requires you to enable Oracle Java Required Files (JRF) on the cluster. Performance metric data appears on the summary page regardless of whether or not the cluster is Oracle JRF enabled.
Oracle Exalogic Management Enhancements
The following new features related to Exalogic Management help provide enhanced operational visibility:
  • Control Stack monitoring for virtualized Exalogic systems enables administrators to view the status of the software infrastructure.
  • It is now possible to send Enterprise Manager Ops Center hardware alarms and alerts to Enterprise Manager Cloud Control's incident management system and manage hardware and software incidents from a single pane of glass.
  • Exacheck target now appears in the Exalogic Navigation Tree providing in-context navigation to Exacheck results.
  • Additional performance and filtering optimizations has been made to the Exalogic Software Dashboard.
  • Exalogic BI Publisher Reporting has been enhanced.

Diagnostic Snapshot EnhancementsAdministrators have traditionally been able to create a diagnostic snapshot from the Enterprise Manager Cloud Control console whenever a middleware-related issue occurs, and then analyze the diagnostic snapshot in offline mode either from the same Enterprise Manager Cloud Control instance that generated the snapshot or from a completely different Enterprise Manager Cloud Control instance (for example, when the snapshot is sent to Oracle Support for analysis). This release includes the following enhancements to the Diagnostic Snapshot feature:
  • Archived logs for WebLogic Server and JVM targets can be included in a new diagnostic snapshot.
  • You can create a diagnostic snapshot through the EMCLI.
  • You can include diagnostic snapshots in a Support Workbench incident.
These additional Diagnostic Snapshot capabilities reduce the resolution time of external bugs related to Fusion Middleware software.
Archived Log Files Supported in Log Viewer
Administrators can now use Log Viewer to view and correlate messages across archived log files for Fusion Middleware components. In the past, Log Viewer supported viewing and correlating messages from active log files only. Including archived log files in Log Viewer helps administrators to diagnose and resolve performance problems that may have
occurred in the past.
Lifecycle Management Features
Enhancements to Cloning and Scaling Up/Out MiddlewareAdministrators can now use the Provision Middleware or Scale Up/Scale Out Middleware deployment procedures to clone or scale up/out a WebLogic Domain that has its administration port enabled or a domain that accepts only secure SSL traffic. Prior versions of the deployment procedures did not support cloning or scaling up/out of such a configured domain.

In addition, these same procedures now support entering credentials for each host destination individually (applicable in situations where preferred credentials are not used).
Administration Features
Enhancements to Fusion Middleware Process Control Job
The out-of-box job for Fusion Middleware Process Control now offers options for how to start, restart, or stop WebLogic Server targets. Administrators can configure the job to
use. Node Manager, the default script in the domain home, or a custom script. These same options are also available when you initiate a start, stop, or restart operation from target home pages or target menus. This feature gives administrators maximum flexibility in managing and maintaining WebLogic environments.

Perform Administration Operations Against Fusion Middleware
Key administration operations previously available from the Fusion Middleware Control console and WebLogic Server Administration Console are now available from the Cloud Control console. These operations include:
  • Locking a domain configuration through the Change Center before making changes to prevent other administrators from making changes during your edit session. You can also
  • view all changes that have been saved, view the server instances that must be restarted for configuration changes to take effect, release a lock, and activate or undo changes.
  • Viewing, configuring, and using MBeans for a specific Oracle WebLogic Server or Application Deployment target through the System MBean browser.
  • Managing JDBC data sources - including the ability to create, edit, delete, control and test JDBC data sources.
  • Recording configuration actions performed as a series of WebLogic Scripting Tool (WLST) commands. You can use WLST to replay the commands to help automate the task of configuring a domain. You can start, stop, or view a recording.
Having a single tool for both monitoring and administering Fusion Middleware components simplifies an administrator's job and increases productivity.
Selective Tracing for Oracle Fusion Middleware
Administrators can now perform selective tracing from the Cloud Control console. Selective tracing enables administrators to gain more fine-grained logging data but limit the
data so that it applies to a specific application name as well as other specific attributes of a request (for example, user name, client host, or web service port). Having such detailed yet focused log data assists administrators while diagnosing problems with applications and their underlying infrastructure.

Privilege Propagating Support for Oracle WebLogic Server and Oracle Application Server Related TargetsBeginning with this release, the following Oracle Fusion Middleware related target types support privilege propagation:
  • Oracle WebLogic Domain
  • Oracle WebLogic Cluster
  • Oracle WebLogic Server
  • Domain Application Deployment
  • Clustered Application Deployment
  • Oracle Application Server
  • Oracle Containers for Java (OC4J)
This support enables administrators to have privileges automatically propagate to members of a target, rather than requiring the administrator to manually grant other administrators privileges to each target individually. You can grant to an administrator or a role a privilege on one of the listed targets once and have that same privilege automatically propagate to any new member of that target.

For example, granting operator privilege on a WebLogic Domain target to an administrator grants the administrator the operator privilege on the domain's member targets (for example, clusters, servers, deployed applications) and also to any members that will be added to the domain in the future. Automation of privilege propagation across these additional Fusion Middleware targets enables administrators to be more effective and efficient in managing their middleware software.
Log Configuration for Oracle Fusion Middleware Components
Beginning with this release, administrators can configure log file settings for Oracle WebLogic Server, Application Deployment, SOA Infrastructure, Essbase Server, Directory
Integration Platform Server, Oracle Virtual Directory, Oracle Reports Application, Oracle Reports Bridge, Oracle Reports Server, and Oracle Reports Tools targets. Configuration
settings exposed in the Cloud Control console user interface include:
  • Location of the log file
  • Format of the log messages in the log file (For example, Oracle Diagnostic Logging – Text, Oracle Diagnostic Logging – XML)
  • Log level for both persistent loggers and active runtime loggers
  • Rotation policies – either size based or time based – used for the log file

User Interface Updates for Site Guard Operations
You can use the new Site Guard user interface to create, execute, and monitor operation plans for switchover, failover, start, and stop.
RUEI Metric Page
The RUEI Metric page uses the same search mechanism as the Session Diagnostics page but here the result set is displayed in the Metric Correlation Chart where RUEI metrics can
be compared against all other system metrics and be displayed in time. This means that End User Page Load times can be presented in time compared with Java active threads or
system CPU usage to discover possible connections. Any view can be stored in the correlation chart. This page can also be directly opened from any RUEI event from the Events and Incidents console. All RUEI events have a link to the metrics page and when selected, the Metric page opens in context of the right metric filters and time period immediately.

JVM Real-Time Thread State
This regions displays a list of all of the JVMs that are associate with the Business Application. It provides a per JVM view of real-time status based on the JVM thread
activities. You are presented with thread counts of specific activities and states including DB Wait, IO Wait, Runnable, and Idle. The number of threads counted in a specific
state reflects how much work a JVM is performing on that area. For example, a larger than normal thread count in DB Wait state suggests a slower than normal DB response time.

The region also provides direct access to the JVM Diagnostic pages for more detailed investigation. This region is updated with real-time data every 30 seconds.
JVM Active Threads

This region provides an overtime view of the data presented by the JVM real-time Thread State region. The data is summarized across all of the JVM and presented for the last 24
hours.
Application Replay
Application Replay enables you to perform realistic production scale testing of your web and packaged Oracle applications. It provides the most efficient and highest quality
testing through zero overhead workload capture and without any need for script development and maintenance. The captured workload can then be replayed with production characteristics on a test system to validate application infrastructure changes from the middle tier to the disk.

Application Replay Enhancements

Note:
These enhancements are new in the 12.1.0.3 release.

After a successful replay, users were able to view reports to analyze, capture, and replay results. The reporting mainly focused on application page names and addressed questions such as what was the performance of the page and which pages diverged compared to capture.

Now users have the ability to not only look at page level diagnostics but also session level diagnostics. With this new ability, you can answer questions such as which sessions
showed poor performance and then quickly identify the pages where the session was experiencing poor performance.

Additionally, to ensure that a page's poor performance is not caused by setup issues, a divergence report showing differences between the capture and replay of pages is provided. Similarly, when ensuring that a session's performance is not due to a divergence between capture and replay, users were required to view the raw HTTP requests and
response contents manually and compare the difference. Now users can simply export a packaged zip file containing capture and replay content and diagnostics and import that into Oracle Application Testing Suite's OpenScript. Doing this enables an automated and visual comparison of capture and replay of a specific session, drastically reducing the time
to identify any divergence or potential performance issues.

These diagnostics improvements enable deeper analysis of replay results quickly and reduce the time to isolate potential issues in a replay environment with perspective of end
user sessions.

For more details, pls refer http://docs.oracle.com/cd/E24628_01/doc.121/e25353/whats_new.htm#CJAGBIEC

Tuesday, April 23, 2013

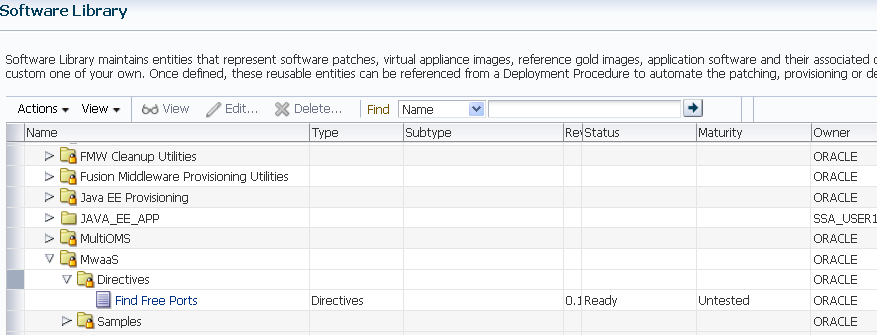
EM12c: MWaaS instance provision request Failed - Error evaluating expression ${ora:getEntityURN('MwaaS/Directives/Find Free Ports')} for parameter directive_urn

Error: After setting up MWaaS, user always gets error at step “Find Free Ports” when try to request a service from self service portal:

------emoms.log contains----------
2013-04-18 13:40:15,317 [PAFDaemon] ERROR procedure.engine logp.251 - Unable to resolve URN for Software Library Entity with internal path: MwaaS/Directives/Find Free Ports
oracle.sysman.emSDK.core.job.procedure.exception.ProcedureException: Unable to resolve URN for Software Library Entity with internal path: MwaaS/Directives/Find Free Ports
at oracle.sysman.emdrep.jobs.procedure.func.GetURNFromInternalPath.execute(GetURNFromInternalPath.java:146)
at oracle.sysman.emdrep.jobs.procedure.engine.el.parser.FunctionExpression.eval(FunctionExpression.java:214)
at oracle.sysman.emdrep.jobs.procedure.engine.el.parser.Expression.eval(Expression.java:38)
at oracle.sysman.emdrep.jobs.procedure.engine.el.ExpressionManager.eval(ExpressionManager.java:111)
at oracle.sysman.emdrep.jobs.procedure.engine.el.ExpressionManager.eval(ExpressionManager.java:83)
at oracle.sysman.emdrep.jobs.procedure.impl.BindingStepImpl.resolveVariable(BindingStepImpl.java:300)…

------emoms.trc contains------
2013-04-18 13:29:03,211 [PAFDaemon] ERROR procedure.engine logp.251 - Error getting URN for path: MwaaS/Directives/Find Free Ports
2013-04-18 13:29:03,244 [PAFDaemon] ERROR diagnosability.DiagnosabilityService logp.251 - [EM-03654] Problems with job submission during procedure execution.
oracle.sysman.emdrep.jobs.procedure.impl.JobSubmissionException: Error evaluating parameters.
         at oracle.sysman.emdrep.jobs.procedure.impl.JobProducerImpl.submitJob(JobProducerImpl.java:337)
         at oracle.sysman.emdrep.jobs.procedure.engine.impl.JobProducerStateImpl.execute(JobProducerStateImpl.java:686)
         at oracle.sysman.emdrep.jobs.procedure.engine.impl.JobProducerStateImpl.execute(JobProducerStateImpl.java:642)


Action: Re-import the metadata of software lib, after re-import, Pl. ensure that it should look like as given below:


Now retry request provisioning.

Wednesday, March 13, 2013

EM12c: How to change Company logo in BI Publisher reports?

NOTE: please take backup of landscape.rtf and portrait.rtf before doing any modifications.

1. Login to BI Publisher with sysman credentials

2. Goto Home -> Catalog Folders -> Shared Folders -> Enterprise Manager Cloud Control -> EM_Subtemplates   In the right panel, we will see

      - landscape
      - portrait

3. Click on Edit link of landscape.

4. In the "Templates" section click on the link "English (United States)" and open it in MS Word.  The file name will be landscape.rtf.

5. Edit "Oracle Enterprise Manager" image in the top left corner with required company name image and save it with save name and file type (rtf).

6. In the "Templates" section click on upload icon.

   It will open popup
    Template Name :         Browse to the previously saved landscape.rtf
    Template Type :        rtf
    Locale :      English (United States)

7. Click OK

8. It will ask for confirmation to overwrite previous rtf file. Click OK.

9. Click on Save icon the top right corner.

10. Repeat the same steps for "portrait" format also (doc name will be portrait.rtf in this case).

Tuesday, March 05, 2013

EM12c: How to fix BIP "Login failed, please retry." error?

Issue: On machine reboot, when EM is started. BIP server doesn't start on its own. One has to specifically start the BI server.

When BIP server is started via startManagedWebLogic.sh script. EM user is not be able to login to BI server and see any BIP report.

and BIP server log contains following error(s):
Exception caught while getting credentials access denied
(oracle.security.jps.service.credstore.CredentialAccessPermission  context=SYSTEM,mapName=EM,keyName=REPOS_DETAILS read)
java.security.AccessControlException: access denied
(oracle.security.jps.service.credstore.CredentialAccessPermission
context=SYSTEM,mapName=EM,keyName=REPOS_DETAILS read)
        at java.security.AccessControlContext.checkPermission(AccessControlContext.java:374)

---
---
EMReposLoginModuleImpl: throwing FailedLoginException: Authentication Failed: Invalid
username/password


Action: One should start/stop BI server either via weblogic admin console or via WLST commands e.g.

To start BIP serverexport WLST_PROPERTIES=-Dweblogic.security.TrustKeyStore=DemoTrust
$MW_HOME/oracle_common/common/bin/wlst.sh
connect('weblogic','<passwd>','t3s://<hostname>:<port>')
start('BIP')


To stop BIP serverexport WLST_PROPERTIES=-Dweblogic.security.TrustKeyStore=DemoTrust
$MW_HOME/oracle_common/common/bin/wlst.sh
connect('weblogic','<passwd>','t3s://<hostname>:<port>')
shutdown('BIP', force='true')

Wednesday, January 30, 2013

EM12c: How to install and integrate BI Publisher with OEM?

Note: With Enterprise Manager 12c Cloud Control Release 2 (12.1.0.2.0), Only BI EE 11.1.1.6.0, is supported while With Enterprise Manager 12c Cloud Control Release 1 (12.1.0.1.0), Only BI EE 11.1.1.5.0, is supported for use .
[BI Publisher 11.1.1.5.0 or 11.1.1.6.0 can be downloaded from http://www.oracle.com/technetwork/middleware/bi-enterprise-edition/downloads/bus-intelligence-11g-165436.html]

BI Publisher installation and integration with EM is a two step process.
1. Do a software only install of BI Publisher
Install BIP using runInstaller binary and ensure to do software only install.

2. Integrate BIP with EM 12c
a. goto GCDomain dir. Take backup of this dir.
b. Goto $OMS_HOME i.e. $MIDDLEWARE_HOME/oms/bin directory
c. run configureBIP
Provide 'sys', 'Admin Server user' and 'Node Manager' password.

On demand demo/screenwatch of entire install and integration process can be accessed from here

Monday, December 10, 2012

EM12c: How to create OS script based Metric Extension and deploy it on a target?

To create OS shell script based metric extension (ME), follow given steps:

1. Select Enterprise->Monitoring->Metric Extensions

2. Provide values for the metric extension properties in Create New wizard first page.


3. Provide shell scripting binary like /bin/sh, Shell Script name, Delimiter and Starts With expression as given below and Select Add button to add the shell script.


4. In this example, very simple script has been specified to explain the steps.


5. In next step of wizard, one needs to specify the output columns. As per given sample script, two columns Uptime and Users have been created here.


6. Select Credentials in next step to be used for this metric extension.


7. To test this metric extension, select Test Targets


8. Click on Run Test button to test the metric extension on Test target. You should see test output in Test Results panel.


9. Before submitting, review final definition for proposed metric extension.


10. Metric Extension is successfully created.


11. Once the metric extension is created, next step would be to save it as Deployable Draft as given below.


12. Once the status of metric extension shows as Deployable Draft. Select the metric extension and Deploy it to target as shown below.


13. You should see that the Metric Extension is deployed successfully.


14. After 15 min., Go to the target where this metric extension has been deployed. Select Monitoring->All Metrics. Yous should see following:

Friday, November 09, 2012

EM12c: How to change the EM Agent Port?

The EMAgent uses a particular port to receive requests from the OMS. This port number is defined by default when one installs the EMAgent on a target host.
If one needs to modify this port at some point, one can use the following steps.

To change the EMAgent port:

1. Stop the EMAgent.
$ $AGENT_HOME/bin/emctl stop agent

2. Modify the $AGENT_HOME/sysman/config/emd.properties file in the EMAgent home directory:
    For example:
    EMD_URL=http://abc.xyz.com:3872/emd/main

    Modify the <port number> in the EMD_URL property so the EMAgent uses a new unused port on the target host.
    EMD_URL=http://abc.xyz.com:3875/emd/main

3. Start the EMAgent.
$ $AGENT_HOME/bin/emctl start agent

Note:
With this port change the target name of agent will not change on OMS side, it will still show the original port. But it will work using the new port now as given below

$ ./emctl status agent
Oracle Enterprise Manager Cloud Control 12c Release 2 
Copyright (c) 1996, 2012 Oracle Corporation.  All rights reserved.
---------------------------------------------------------------
Agent Version     : 12.1.0.2.0
OMS Version       : 12.1.0.2.0
Protocol Version  : 12.1.0.1.0
Agent Home        : /home/oracle/agent12c/agent_inst
Agent Binaries    : /home/user01/agent12c/core/12.1.0.2.0
Agent Process ID  : 5732
Parent Process ID : 5643
Agent URL         : https://abc.xyz.com:3875/emd/main/
Repository URL    : https://oms.xyz.com:4901/empbs/upload
Started at        : 2012-11-09 10:02:47
Started by user   : oracle
Last Reload       : (none)
Last successful upload                       : 2012-11-09 11:35:21
Last attempted upload                        : 2012-11-09 11:35:21
Total Megabytes of XML files uploaded so far : 0.2
Number of XML files pending upload           : 0
Size of XML files pending upload(MB)         : 0
Available disk space on upload filesystem    : 64.97%
Collection Status                            : Collections enabled
Heartbeat Status                             : Ok
Last attempted heartbeat to OMS              : 2012-11-09 11:37:11
Last successful heartbeat to OMS             : 2012-11-09 11:37:11
Next scheduled heartbeat to OMS              : 2012-11-09 11:38:11

---------------------------------------------------------------
Agent is Running and Ready

Wednesday, October 31, 2012

EM12c: Managing the Manager (MTM) with EM12cR2


With release of EM12cR2, it has MTM pages to manage the Enterprise Manager more effectively. 
These MTM pages contain monitoring and diagnostic info for the EM itself. Using these pages, one can
-view the health of EM and its various components like OMS, repository, services etc
-track the performance (notification, upload etc.)
-view diagnostics info
-manage agents

Health Overview Page
Select Setup ->Manage Cloud Control-> Health Overview


All major areas of Enterprise Manager are shown here. It has:
Overview: Provides key information for active Management Services such as the Management Agents, the WebLogic Administration Server, total number of monitored targets, number of administrators, and server load balancer (SLB) upload and console URLs, provided SLB is configured. If configured, the SLB upload and console URLs are also displayed.

Repository Details: Provides physical information about the Management Repository and the host on which the database is located. You can drill down into the database home page for more information and carry out administrative operations.

Job System Status: Displays key operational parameters of the Enterprise Manager Job service. For detailed information, you can click on the status icon to drill down into the Enterprise Manager Job Service home page.

Console Activity: Displays the overall load on the Enterprise Manager console through the average number of requests per minute and the average time required to process those requests.

Alerts: Provides details on the metric errors recorded and when an alert was triggered. In-context links to Incident Manager are also provided.

Performance Charts: Upload Backlog and Upload Rate, Backoff Requests, Notification backlog. One can drill down into any chart to view detailed metric information.

One can also see diagnostics metrics.

Repository Page
Select Setup ->Manage Cloud Control->Repository

The Repository page provides you with an overview of the status and performance of the Repository DBMS Jobs that handle part of EM’s maintenance and monitoring functionality. These DBMS jobs run within the Management Repository and require no user input. Charts showing the key Repository Details and Backlog in Repository Collection are provided. The Scheduler Status region provides the status of the scheduler and the number of Job Queue Processes.

From the Repository Details region, one can expand Management Service Repository Sessions details to view the exact number of repository connections per individual Enterprise Manager sub-component such as the event system, console, job system, or connector framework.

The Repository Scheduler Jobs Status region provides details of the DBMS Jobs regarding their status, throughput, processing time, the next scheduled run and the last scheduled run.

Advanced Queuing (AQ) provides database-integrated message queuing functionality that allows application messages to be stored persistently and propagated between queues on different machines and databases. The Management Services AQ Status region list the details of DEQUEUE and ENQUEUE status for messages specific to the Management Services AQ.


Agents Page
Select Setup -> Manage Cloud Control-> Agents.

The Agents page lists all Management Agents within your monitored environment. This page also includes misconfigured, blocked and upgradable and non- upgradable Agents.
From here one can navigate to any agent's homepage.


Management Services
Select Setup -> Manage Cloud Control->Management Services

The Management Services page displays the list of Management Services, their status, incidents, the loader throughput , CPU usage, and the JVM memory usage metrics. In addition, the Management Services displayed can be filtered by Normal Mode, Console Only, PBS only and Standby Management Services.

Viewing Enterprise Manager Topology and Charts
 To view EM topology
Select Setup-> Manage Cloud Control ->Health Overview
Select OMS and Repository menu ->Members-> Topology
The Enterprise Manager Topology page provides a graphical representation of the Enterprise Manager infrastructure components and their association. Each node in the hierarchy displays key information about the member type, the host on which it resides, and the number of incidents, if any. The incident icons on each of the nodes expand to display a global view of current status for each node in the hierarchy.

To view EM charts
Select Setup-> Manage Cloud Control ->Health Overview
Select OMS and Repository menu ->Monitoring -> Charts

The Enterprise Manager Charts page displays eight charts representing key areas that together indicate the overall health of Enterprise Manager. These are Overall Files Pending Load -Agent, Job Step Backlog, Job Step Throughput (per second), Request Processing Time (ms), Database Time (centiseconds per second), CPU Utilization (%), Pages Paged-in (per second), Pages Paged-out (per second). Data can be viewed for the Last 24 hours, last 7 days or last 31 days.

For more details, refer http://docs.oracle.com/cd/E24628_01/doc.121/e24473/mtm.htm