Thursday, May 05, 2011

How to trace thread(s) in a JVM using EMGC 11 JVM Diagnostics?

JVM Diagnostics has two ways of monitoring a JVM.
1. It samples JVM on a preset frequency and does monitoring 24X7.
or
2. One can actually trace JVM thread(s).

Tracing allows tracing of an active thread or tracing of All(Active) Threads inside the JVM.
For tracing, JVMD provides following options:

1. to trace all(active) threads of a JVM
Goto Targets->Middleware->JVM Diagnostics->Select specific JVM from left panel.
On right panel, from JVM dropdown, select Threads->Trace Now as given in screen shot


2. To trace all(active) threads of a JVM from Threads-> Real Time Analysis Page.
Goto Targets->Middleware->JVM Diagnostics->Select specific JVM from left panel.
On right panel, from JVM dropdown, select Threads->Real Time Analysis Page.
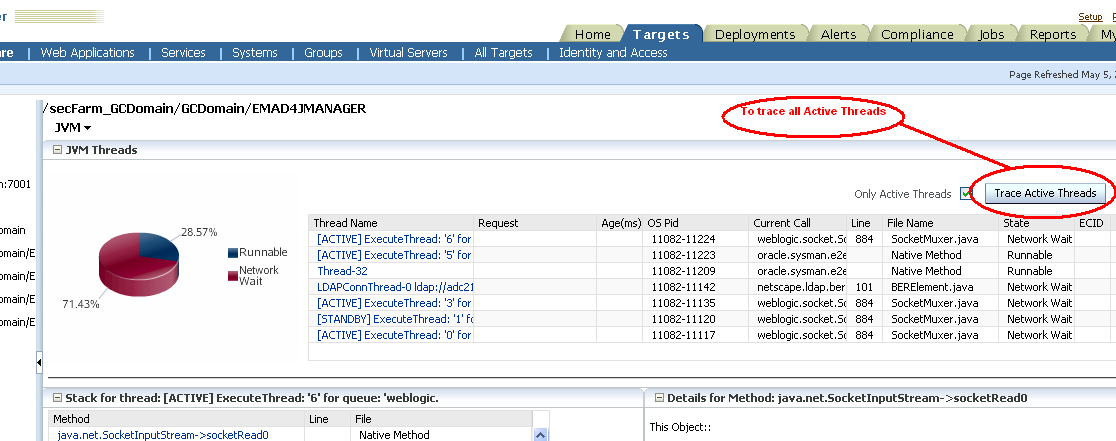
Click on 'Trace Active Threads' button as given in screen shot


3. to trace a specific thread of a JVM from Threads-> Real Time Analysis Page.
Goto Targets->Middleware->JVM Diagnostics->Select specific JVM from left panel.
On right panel, from JVM dropdown, select Threads->Real Time Analysis Page.
Click on 'Trace Thread' link against the Thread Name as given in screen shot.

On selecting any of the above option, you will get page (almost similar page for all options).
Click on 'Start Trace' Button.


Once Trace is completed, you will see a message as given in next screenshot. To view the completed Trace, Click on 'Goto saved trace' link


To view all traces, Goto Targets->Middleware->JVM Diagnostics->Select specific JVM from left panel.
On right panel, from POOL/JVM dropdown, select Threads->Saved Traces option. It will show all saved traces like below.


Click on Samples, to view the trace details.

In next article, I will try to explain how to view these Traces.


Friday, April 29, 2011

ADP agents in PROVIDER_FOUND status

There were quite a few adp agents in PROVIDER_FOUND status. Some agents in REPORTING status. But these agents with PROVIDER_FOUND  never changed status.  r logs
I did not see any error message in ADP manager logs.

ADP agent log had following error:
----
...,AcseraJavaAgentListener,JavaAgent,post-provider: mem used = 49.848 MB, free = 505.464 MB, total = 555.313 MB, max = 986.125 MB
...,AcseraJavaAgentListener,JavaAgent,awaiting AcseraJavaProvider: Connection refused to host: x.x.x.x; nested exception is:   java.net.ConnectException: Connection timed out
...,AcseraJavaAgentListener,JavaAgent,mem used = 34.117 MB, free = 521.196 MB, total = 555.313 MB, max = 986.125 MB
---

What does PROVIDER_FOUND status mean ?
It means that ADP Agent has found ADP Manager's RMI Registry entry, but not yet established connection.

Action: In this case, one is suggested to verify if the manager RMI ports (especially RMI.JavaProvider.ServerPort) are accessible from ADP agent machine.
Remember for each resource in ADP, a separate RMI.JavaProvider.ServerPort is needed and should be accessible.

Thursday, April 14, 2011

RMI Ports needed for adp manager-agent communication

If one has firewall between adp agent and adp manager,
one needs to ensure that following ports should be enabled
via firewall on manager end for adp monitoring :

RMI.RemoteServiceController.ServerPort=55000
RMI.JavaProvider.ServerPort=55003
RMI.Registry.Port = 51099


Thursday, March 31, 2011

Jam Agent : Could not find required Ocamm agent class file - What does it mean?

When one deploys jamagent, one often sees this error.
"Jam Agent : Could not find required Ocamm agent class file"
What does it mean?

JVMD and ADP(CAMM) have been integrated for some enhanced functionality
called Request Monitoring in EM11g. Only If you are using Request
Monitoring then this error matters, but in general this error has
no impact on jamagent functionality and can be ignored safely.

Tuesday, March 29, 2011

EM11gc Weblogic Server Mgmt Pack webcast

If you want to know more about EM11gc Weblogic Server Mgmt Pack, there is an upcoming webcast
http://event.on24.com/r.htm?e=289479&s=1&k=1121EF2912BE741AE74702D461C21F98&partnerref=fmwblog  that might help you.

Maximize Oracle WebLogic Server ROI with Oracle Enterprise Manager 11g
Quickly and effectively manage and monitor your Oracle WebLogic Server infrastructure.  Attend this live Webcast and learn how Oracle WebLogic Server Management Pack Enterprise Edition can improve performance and availability, fast-track infrastructure rollout, and avoid costly resource bottlenecks. Register today for the Webcast on Thur., March 31, 2011 @ 10 am PT / 1 pm ET.

Saturday, March 26, 2011

javax.naming.NamingException: Lookup error: javax.naming.AuthenticationException: No such domain/application: "ClearApp"; nested exception with ADP agent Deployment

While trying to deploy ADP agent on 10.1.3.5 Oracle Application Server, following error is seen on ADP UI:
javax.naming.NamingException: Lookup error: javax.naming.AuthenticationException: No such domain/application: "ClearApp"; nested exception

Environment: Its 10.1.3.5 Oracle Application Server (OC4J) - upgrade from 10.1.3.0 or fresh install with no SOASuite (no BPEL or ESB)

Issue: ADP agent assumes that since its 10.1.3.5 OAS, it has SOA and BPEL libraries and it tries to import them.

Action: 1. Modify $ADP_HOME/deploy/Deployer.ear
a. Unjar $ADP_HOME/deploy/Deployer.ear
b. Modify META-INF/orion-application.xml to remove the following lines
   <imported-shared-libraries>
       <import-shared-library name="oracle.bpel.common"/>
   </imported-shared-libraries>
c. Repackage Deployer.ear

2. Deploy ADP agent using normal steps from ADP UI.

Tuesday, March 22, 2011

How many JVMD(AD4J) managers are needed to manage various JVMs?

One JVMD(AD4J) manager can manage upto 256 jamagent.
If one wants to manage more than 256 jamagents, one needs to deploy more
JVMD managers.
Multiple JVMD(AD4J) managers are supported as part of patch 9901141.

Tuesday, March 15, 2011

Not able to add more than 4 resources in the ADP(CAMM) UI

Modify Acsera.properties in $ADP_HOME/config directory.

This property 'ResourceLimit' is in Acsera.properties on the ADP manager, set to 4 by default.
One can change this property, but one needs to ensure to check that the
number of managed entities stays below the amount of memory a single manager can handle.
One should generally try to keep the number of managed entities below 70,000 with a heap
size of around 2GB.

Sunday, February 27, 2011

Why no-data-found message on JVM Diagnostics Page?

Assuming that JVM Dignostics monitoring has been started.
If you are seeing No-Data-Found message on JVM Diagnostics Pages, there can be one of the following reasons:
1. JVMD (AD4J) manager is not deployed or is inactive. If JVMD manager is not yet deployed then deploy the manager. If it is inactive then, follow instructions given on http://neelimabawa.blogspot.com/2011/02/how-do-i-know-if-jvm-diagnostics-ad4j.html

2. JVMD(AD4J) Manager is deployed and is active but is not able to connect to its repository (EM database). May be at some point EM database was restarted but JVMD(AD4J) manager was not bounced at that time. Hence all previous db connections were closed. Solution is bounce the JVMD(AD4J) manager application or may be bounce the managed server that is running the JVMD(AD4J) manager
application. It should resolve DB connection issue.

3. JVMD (ad4j/jam agent) is not deployed on target JVM or may be inactive for some reason. Check agent logs, they should give some pointer.

4. JVMD(ad4j/jam agent) is deployed on target JVM and is also active (confirmed with agent logs) but for some reason, agent is not able to connect to manager.
For more details verify agent logs.

5. JVMD(ad4j/jam agent) is deployed on target JVM and is also active (confirmed with agent logs) also connected to manager. But further data is not getting exchanged betweeb agent and manager. For more details verify agent and manager logs.

6. If you are able to Real Time analysis Thread and Heap pages but no monitoring data. Then most likely that monitoring has not started for that JVM Pool/Domain. To start monitoring for that JVM Pool/Domain, goto Targets->Middleware->JVM Diagnostics->Setup->JVM Pools Page. Edit JVM Pool properties and select 'Poll Enabled' property for that JVM Pool/Domain.

7. If agent was deployed manually. Then listing of agent depends on JVM pool mentioned in its web.xml. If web.xml was not modified then by default, manually deployed agent is reported under 'Default Pool'. By default, monitoring for 'Default Pool' is not started. So one needs to edit JVM Pool properties for
'Default Pool' and select 'Poll Enabled'.

8. Even after doing all the above, if UI shows no data found then one needs to dig into jam agent and manager logs to see what's going on.

Note: a. Ensure that JVMD monitoring is started. Verify it from Targets->Middleware->JVM Diagnostics->Setup->Monitoring Page.
b. JVM Pool/Domain for which you looking for JVMD data, should always have 'Poll
Enabled' proprty selected as mentioned in step 6. .

Wednesday, February 23, 2011

How to compare heaps using JVM Diagnostics?

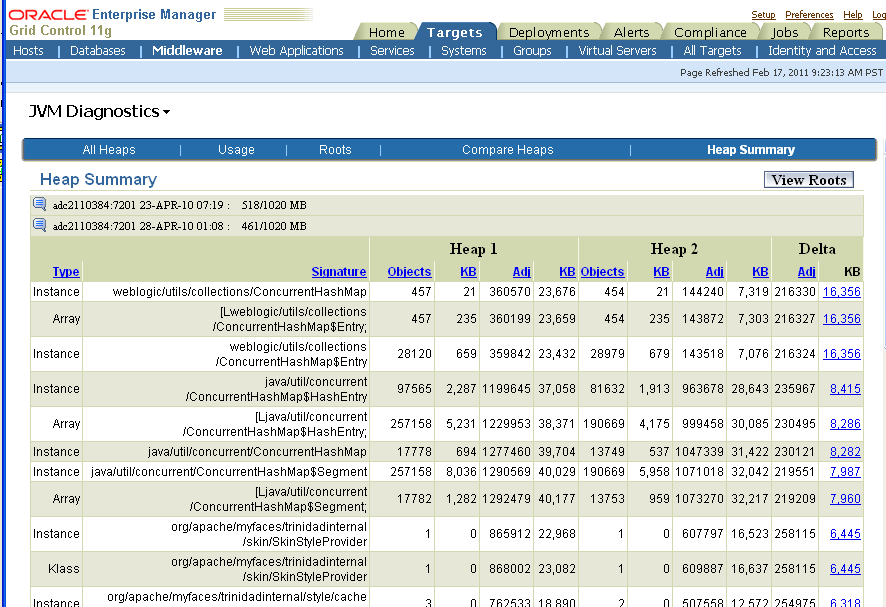
When you suspect there might be some memory leak might be happening in Java/J2EE app. Heap comparision feature would require you to dump two heaps for same JVM over a period of time.  One needs to follow given steps to compare two heaps:
1. Goto Targets->Middleware->JVM Diagnostics page
2. Select target JVM on left Panel
3. Select JVM Menu->Heap->Take Snapshot Now as given in screen shot.

This command would generate a heapdump file on target m/c where JVM is running.
Heapdump filename would be given in next screen and it would be like
/tmp/heapdump<N>.txt .(Default directory for a JVM is /tmp or C:\tmp)

4. Similar way, take another heap snapshot.
5. One you have two heapdump files on target JVM machine. ftp these files to or EM repository machine.
6. Download loadheap.zip from Targets->Middleware->JVM Diagnostics->Setup->Download page. Unzip loadheap.zip, it contains various scripts including :
-loadheap.sh/loadheap.bat,
-create_jvm_diagnostic_db_user.sh/create_jvm_diagnostic_db_user.bat scripts etc.
%create_jvm_diagnostic_db_user.sh
7. Create JVMDIAG user using create_jvm_diagnostic_db_user.sh/bat script.
Note: Use http://download.oracle.com/docs/cd/E11857_01/install.111/e17558/ad4j_setup.htm#CEGGIIBB
8. Load these heapdump files to EM repository as JVMDIAG user using loadheap.sh/bat.
%loadheap.sh <heapdump_filename>
Once both the files are loaded successfully.
9. Goto Targets->Middleware->JVM Diagnostics. Select Pool/JVM->Heap->Saved Heap Snapshots on right panel.


It will give list of loaded heaps in EM repository.


10. Select one heap using % column.
11. Click on 'Compare Heaps' on blue ribbon
12. Select second heap using same % column
13. You can see heap comparison as given screen shots.
14. Click on View Summary to get summary details.


Friday, February 18, 2011

How do I know if JVM Diagnostics (AD4J) Manager is active?

1. To check the Manager status,
Goto Targets->Middleware->JVM Diagnostics->Setup->JVMs&Managers
as given in screen shot

or

2. Goto weblogic server where ad4j manager is deployed
and look at the EMAD4JMANAGER.out file. It should not contain
any errors.

Thursday, February 17, 2011

EM11g - Steps to Deploy AD4J (JVMD) manager on a Remote Machine

Step 1. Install EM agent on the remote host (host2) and point it to the OMS.

Step 2. Install weblogic server bits on host2 using EM installer. (Software only option).  This is to ensure same version and patch level for weblogic server on host2.
e.g. ./runInstaller -noconfig b_softwareonly=true

Step 3. Create a new server using the weblogic console of the emgc domain, name it as 'AD4JRemoteServer'. Make sure the listen address as the one of the remote host and a port number.

Step 4. Create a new machine from the weblogic console. Associate this machine with the nodemanager on remote host.
Enter the correct listen address ( the remote machine ), and the nodemanager port number( default 5556).
Add the managed server created in step 3 (AD4JRemoteServer) to the machine. ( Select the machine created and click on servers )

Step 5 . Now we will create a weblogic template based on EM GC domain running on local host using pack command. And unpack it on the remote host.
./pack.sh -domain=/u01/app/oracle/work/gc_inst/user_projects/domains/GCDomain -template=/u01/app/testing/emgcdomain.jar -template_name="My Weblogic Domain" -managed={true}
Where domain=/u01/app/oracle/work/gc_inst/user_projects/domains/GCDomain is the location of domain on local host. 
And ‘/u01/app/testing/emgcdomain.jar’ is the location where we want to create the template .

Step 6 . Now we will copy emgcdomain.jar to remote host .

Step 7 . Now we will unpack this template on remote host using the unpack command
./unpack.sh -domain=/u01/app/oracle/work/gc_inst -template=/net/myhost1/u01/app/testing/emgcdomain.jar
Where domain=/u01/app/oracle/work/gc_inst is the domain location of the remote machine and ‘/net/myhost1/u01/app/testing/emgcdomain.jar’ is the location of template where you copied emgcdomain.jar in step 6 on remote host.

Step 8. We need to enroll the weblogic domain with node manager using wlst command nmEnroll().
On the remote host, run
a. <Weblogic home>/common/bin/wlst.sh
b. Connect to the admin url of the weblogic console
    connect('weblogic','welcome1','t3://myhost1.us.oracle.com:7001')
    Note: the admin url should be precisely given. No '/' at the end, otherwise it gives weird MbeanServer exceptions
c. Register your domain with the following command
    nmEnroll(<Domain home>) 
    e.g. wls:/GCDomain/serverConfig> nmEnroll('/u01/app/oracle/work/gc_inst')
d. Exit Wlst script using exit()

Step 9. On the remote host, the nodemanager startup file will be located at  <Weblogic Home>server/bin/startNodeManager.sh
Before we run it however, we must set the property startScriptEnabled=true in the nodemanager.properties file.
This is to work around a weblogic JRF bug.
We can easily set it by running this script
<middleware home>/oracle_common/common/bin/setNMProps.sh
Now start the nodemanager using
<Weblogic Home>server/bin/startNodeManager.sh
Note down the nodemanager port number and mode. By default, it will run in ssl mode on port 5556

Step 10. Start up the server AD4JRemoteServer from the weblogic console. It will send a request to the nodemanager to start it and in a short while show up as running.
Weblogic server setup is done. Now discover the EM domain in GC. If you have discovered it already do a “Farm Refresh” so that new managed server is discovered in EM.
Following jars are required by AD4J Manager in 11g. Add these in CLASSPATH of AD4JRemoteManager
“/u01/app/oracle/work/middleware1/oms11g/sysman/jlib/emCORE.jar:/u01/app/oracle/work/middleware1/oms11g/sysman/jlib/emagentSDK.jar:/u01/app/oracle/work/middleware1/oms11g/sysman/jlib/log4j-core.jar:/u01/app/oracle/work/middleware1/oms11g/sysman/jlib/emcoreAgent.jar”
Save and then restart the server for it to take effect.

Step 11. If you are using EM 11g, proceed to Weblogic Console to deploy AD4J Manager i.e. jammanager.ear
Download jammanager.ear from OMS i.e. Targets->Middleware->JVM Diagnostics->Setup->Download Page and deploy it on target AD4JRemoteManager. You need to ensure that port no. 3600 is available on remote host. This is the listen port that ad4j manager needs.

Thursday, February 10, 2011

Middleware mgmt: How to generate URL availability report for web applications?

1. Goto Targets->System, Add System, Provide System Name say ad4j,
2. Add Components to system. In my case, I added two weblogic Servers as Target components.
wls1 -> that has webapp1 URL
wls2 -> that has webapp2 URL
3. Goto Target->Services,
Add Generic Service ,
Provide Service Name e.g. ad4j_service
Select System i.e. ad4j Define Key components of system (Select needed web applications, in my case it's ad4j_http_test and petstore_http_test)
Define availability based on Service Tests
Select Test Type -> Http Ping->Give url_test_name and specify complete webapp1_url
Create Beacon->select agent which will be executing the http url test->Create beacon for that
Click on 'Verify Service Test', then move to next step
Select Performance Metrics (I went for default values for now)->next->..
Click on Finish
4. Till now we have defined the  system and Service based one web application url. Let's add another webapp_url.
Again goto Targets->Service
Select service web_app_service and click on 'Configure' button
Goto 'Monitoring Configuration'->Select Service Tests and Beacons
Add another 'HTTP ping' test -> Provide test name and url->Verify Service test and click on 'ok'
Enable newly added test
When check box appears under 'Key Service Test', select all tests and click on 'Change Key tests' button below this table
click ok
5.Goto 'Monitoring Configuration'->Availability Definition
Select 'At least one key service test is successful'. Click OK.
Select Yes when asked for confirmation.
6. You can get the URL availability report under Targets->Services
Click availability status icon for selected service.
It will give detailed report for entire service.

Given is example of URL availability if anyone of the URL is available and user wants to show status of web app as Up.

If one wants all URLs to be up and then show status as up, one needs to modify the availability Definition for Service and select service test rule as 'All key service tests are successful'.

Monday, February 07, 2011

Target Weblogic Server shows status down in OEM even though server is Up.

Weblogic Server has been discovered and added. It's up but in Grid Control UI, status shows down and emagentfetchlet.log shows following error:
Error encountered after accessing the mbean(java.lang:type=Runtime) for metric weblogic_j2eeserver:jvm_runtime from server:service:jmx:t3://:/jndi/weblogic.management.mbeanservers.runtime:: java.lang:type=Runtime Cause: null

Then :
1. Verify that Target Weblogic Server Domain->Advance seetings should contain Platform MBean Server Enabled.
2. Restart Weblogic Server
3. Try refreshing WLS Domain
4. If nothing works try deleting and adding Weblogic target.

Thursday, February 03, 2011

What is acsera agent?

acsera agent is ADP (Application Dependency and Performace) agent. Also known as CAMM agent. It's a j2ee application that is deployed on an app server to diagnose composite apps and get ADP metrics.

Wednesday, January 26, 2011

An internal system error on ruei login screen

RUEI 6.5.1 is installed successfully without any error.
While trying to access RUEI url, login screen shows error as in following screenshot:


An internal system error is seen in /ruei/var/opt/ruei/processor/log/websensor*dbg file and this error is thrown even before showing login prompt screen.
Exception: An internal system error has occurred. Please contact the Administrator with the error details.
Code: 256
Stack trace: #0 /ruei/opt/ruei/gui/include/data/monitoring.inc.php(3566): uxQuery->Execute()
#1 /ruei/opt/ruei/gui/proxy.php(829): utGetNotificationProfile(1001)
#2 {main}

Action:
Verify the permission of $RUEI_DATA directory.
Ensure that 'apache' user has read permission for $RUEI_DATA directory so that it can read the oracle wallet.
%chmod 750 $RUEI_DATA

Friday, January 21, 2011

How to add SOA Server (any FMW) Target in EMGC 11g?

Steps for discovering SOA (any FMW) target:
1.      Log into Enterprise Manager Grid Control.
2.      Goto Targets -> Middleware tab.
3.      Select Oracle Fusion Middleware/WebLogic Domain from the Add menu on top right drop down of page, then click Go.
4.      Enter the hostname of the WLS Admin Server of SOA domain for the domain in the Admin Server Host field. e.g. host1.abc.com
5.      Enter the WebLogic Admin Server port. Default value is 7001.
6.      Enter the WebLogic Admin Server username and password.
7.      Select or specify the hostname and port of the EM Agent that will monitor the domain. For EMGC 11g,  11.1 EM Agent is needed.
8.      Specify a Unique Domain Identifier. This value is used as a prefix to ensure farm names are unique in environments with the same domain name. By default, the name "Farm", followed by a two-digit number, such as, "Farm01" appears.
9.      Optionally provide the Java Management Extensions (JMX) Service URL that will be used to establish a JMX connection to the WebLogic Admin Server. For example:
service:jmx:t3://host1.abc.com:5555/jndi/weblogic.management.mbeanservers.domainruntime
        If no value is provided, EM will use the Service URL based on the host port and protocol.
10.    Click Continue. EM will discover all FMW targets within given domain.
11.    Click Close in the Finding Targets page to automatically assign EM Agents to the discovered targets.
       The Assign Agents page lists all the discovered FMW targets and the EM Agent assigned to each of them. Agents are automatically assigned as per following rule:
          *    If a local EM Agent is found on the domain host, that EM Agent will be assigned.
          *    If a local EM Agent cannot be found, the EM Agent specified in the Targets page will be assigned.
       Note: that one can also manually assign EMAgents to specific targets, if desired.

14.    Click Add Targets to assign Management Agents as listed in the Assign Agents page.
       The Saving Target to Agent processing page appears, indicating how many total targets have been added and successfully saved. It will also indicate the numbers of targets that were unsuccessfully added.
15.    Click Close when finished. The Results page displays the discovered targets and EM Agent assignments.
16.    Click OK when finished. There might be some delay before discovered FMW targets are visible and monitored.  
Note: Pl. ensure that all the EM agents used for monitoring the targets must be up and running.


Wednesday, January 19, 2011

How to configure ADP (OCAMM) for Weblogic with EMGC11g on Linux platform

Note: One MLR has been released since EMGC 11g release.
It is recommended to apply the given patches in order for ADP(OCAMM) to work properly.
p9901141_111010_Generic for the OMS
p9930117_111010_Generic for the EMAgent

I'm assuming that user is configuring ADP (OCAMM) for first time in EMGC. If customer has already configured OCAMM previously then there would be additional steps to undeploy old ADP manager and agents before applying the patch and some steps would be bit different.
Though the steps for configuring ADP setup are given in http://download.oracle.com/docs/cd/E11857_01/install.111/e17558/enable.htm

Before starting one must be prepared with info that would be needed for configuring OCAMM in EM11g. Pre-requisite is:
a.     Have a database setup and its details ready. Create a database user adp that would be needed for setting up ADP.
b.     Have following details of target application servers handy:
·         admin server host
·         admin server port
·         admin user name
·         admin password
·         admin connect protocol (for example, t3 or t3s)

Setting up OCAMM would involve:
1.  Installing ADP manager
a.     Goto OMS home i.e. %cd $ORACLE_HOME/ocamm
b.     Take the ocamm.zip to machine where you want to deploy ADP manager. Then unzip %unzip ocamm.zip
c.     Run Disk1/InstData/<platform>/VM/install.bin
d.     Do not create links. (For detailed instructions follow link given above.) Install ADP manager in <ADP_HOME> location.

2. Registering the ADP Manager with EMUI
a. Start the configuration console by running <ADP_HOME>/bin/config.sh. Ignore console UI. Goto EM OMS UI.
b. Targets->Middleware->Application Dependency and Performance(link at bottom of page) Page.
c. On left Panel, click on Registration tab and then Manager. Register installed ADP Manager on default port 51099.
d. Test connection and add it.


3. Configuring Database for ADP repository
a. Click on Configuration tab, select the Database Configuration node. Edit the default database configuration MyOracle for ADP repository.
b. Provide database access credentials of user adp created earlier.
c. Test Connection to verify database connection and then click OK

4.  Shut down the configuration console by running <ADP_HOME>/bin/acshut.sh ( Wait about 30 seconds after acshut.sh exits for the shutdown to complete )
5. Deploy <ADP_HOME>/deploy/HttpDeployer.ear on Target Application Server (Admin Server)
For target WebLogic server, deploy <ADP_HOME>/deploy/HttpDeployer.ear to target application server’s Admin Server.
6. Start the ADP Manager by running <ADP_HOME>/bin/acsera.sh (for example, nohup ./acsera.sh &")


7. Configuring Target resources that would be monitored using ADP agent
a. Click on Configuration tab, enter Target application server(AdminServer) access information e.g. for Oracle WebLogic Server, the fields listed are the following:
·         Protocol: enter t3 or t3s
·         Host: DNS name or IP address of the WebLogic Admin server for the monitored domain. (Note: If a <listen-address> is specified for the admin server, the name listed here must match that parameter.
·         Port: Port which the WebLogic Admin server is listening for t3 connections.
·         Http Host: DNS name or IP address of WebLogic server where the HttpDeployer.ear is deployed (usually the admin server).
·         Http Port: Port where the Weblogic server on which HttpDeployer.ear is deployed and is listening for connections
·         Http Protocol: Either http or https depending on the configuration of the WebLogic server where the HttpDeployer.ear is deployed
·         Admin Server User ID: User name to access the WebLogic admin server
·         New Password: Password for the username used to WebLogic admin server
·         Retype New Password: Repeated password for the username used to access the WebLogic admin server
Note: Rest of the fields are not valid for 11g, hence leave them as they are
b.     Click OK to return to the previous screen
c.     Click Test Connection. Wait for the <ADP_HOME>/lib/bea/<version>_runtime directory to be created and populated with jar files. This could take a few minutes. ( If nothing happens, check log/manager-log#.csv for exceptions.)
8. Deploy ADP agent on Target Weblogic Servers
a. Click Back to return to the previous screen and then click Deploy
b. On the next screen, select Deploy from the Command menu and then select the servers/cluster where you want to deploy the ADP Agent. Ensure that the admin server is always selected.
Note: In the case of WebLogic Portal, AdminServer is always selected. Please unselect / select Nodemanager in case of weblogic based on how do configure the Weblogic manager to start.
c. Click Continue
d. Wait for deployment to complete. Verify that the UI reports Deployment Successful;( if not, check for exceptions in <ADP_HOME>log/manager-log#.csv)
e. To view the status on the same page, click Refresh. Note that you might have to click Refresh a few times as it might take a while to deploy and update the status. Depending on the number of managed servers in your domain, it could take several minutes (up to 60 seconds per managed server) for this operation to complete. Stay on this page and monitor the manager log until some status is returned.
f. Click Back to return to the previous screen and then click Save


9. Shut down the ADP Manager by running <ADP_HOME>/bin/acshut.sh
Wait about 30 seconds after acshut.sh exits for the shutdown to complete

10. Restart the application servers where ADP agent has been deployed.

11. Start the ADP Manager by running <ADP_HOME>/bin/acsera.sh (for example, nohup ./acsera.sh &")

12. Wait for a while for  discovery to occur. You can check that discovery is happening by looking to see if <ADP_HOME>/darchive/server_archive is created and growing, and then that <ADP_HOME>/darchive/app_archive is created and growing. If you think something is going wrong, you can check log/manager-log#.csv for exceptions, but this process can take several minutes.

13. To view ADP pages from the Grid Control Home page, click Targets-> Middleware-> Application Dependency and Performance-> Monitoring tab.

14. Verify that all servers to which you deployed the ADP Agent are up and running. Click the manager node in the Monitoring tab. The Agent information is available in the Main Display window.

ArrayIndexOutOfBoundsException on JVM Pools page

While configuring 11g JVM Diagnostics, following patches were applied:
9901141 for OMS and
9930117 for Agent
After applying the patch, ad4j Manager was deployed. Manager deployment
was successful. Now on clicking JVM diagnostics->Setup->JVM Pools page, exception appears as given in image:

Issue is with cache here.
Solution: In this case
1. stop the OMS
2. mv user_projects/domains/GCDomain/servers/EMGC_OMS1/tmp user_projects/domains/GCDomain/servers/EMGC_OMS1/tmp_bkp
3. delete user_projects/domains/GCDomain/generated_classes/jsp_servlet/_e2e/_ad4j directory
4. start OMS
For multiple OMSs, repeat the process on each OMS. Clearing the cache would resolve the issue.

Monday, January 10, 2011

How to view ad4j pages in enterprise manager 11g?

In EM11g, following two privileges have been added for accessing AD4J pages.
1. JVM Diagnostics Administrator and
2. JVM Diagnostics User
Any user that has above privileges can access AD4J pages. OR even Superuser can access the ad4j Pages.