When you suspect there might be some memory leak might be happening in Java/J2EE app. Heap comparision feature would require you to dump two heaps for same JVM over a period of time. One needs to follow given steps to compare two heaps:
1. Goto Targets->Middleware->JVM Diagnostics page
2. Select target JVM on left Panel
3. Select JVM Menu->Heap->Take Snapshot Now as given in screen shot.
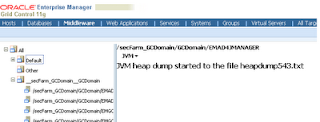
 This command would generate a heapdump file on target m/c where JVM is running.
Heapdump filename would be given in next screen and it would be like
/tmp/heapdump<N>.txt .(Default directory for a JVM is /tmp or C:\tmp)
4. Similar way, take another heap snapshot.
5. One you have two heapdump files on target JVM machine. ftp these files to or EM repository machine.
6. Download loadheap.zip from Targets->Middleware->JVM Diagnostics->Setup->Download page. Unzip loadheap.zip, it contains various scripts including :
-loadheap.sh/loadheap.bat,
-create_jvm_diagnostic_db_user.sh/create_jvm_diagnostic_db_user.bat scripts etc.
%create_jvm_diagnostic_db_user.sh
7. Create JVMDIAG user using create_jvm_diagnostic_db_user.sh/bat script.
Note: Use http://download.oracle.com/docs/cd/E11857_01/install.111/e17558/ad4j_setup.htm#CEGGIIBB
8. Load these heapdump files to EM repository as JVMDIAG user using loadheap.sh/bat.
%loadheap.sh <heapdump_filename>
Once both the files are loaded successfully.
9. Goto Targets->Middleware->JVM Diagnostics. Select Pool/JVM->Heap->Saved Heap Snapshots on right panel.

It will give list of loaded heaps in EM repository.

10. Select one heap using % column.
11. Click on 'Compare Heaps' on blue ribbon
12. Select second heap using same % column
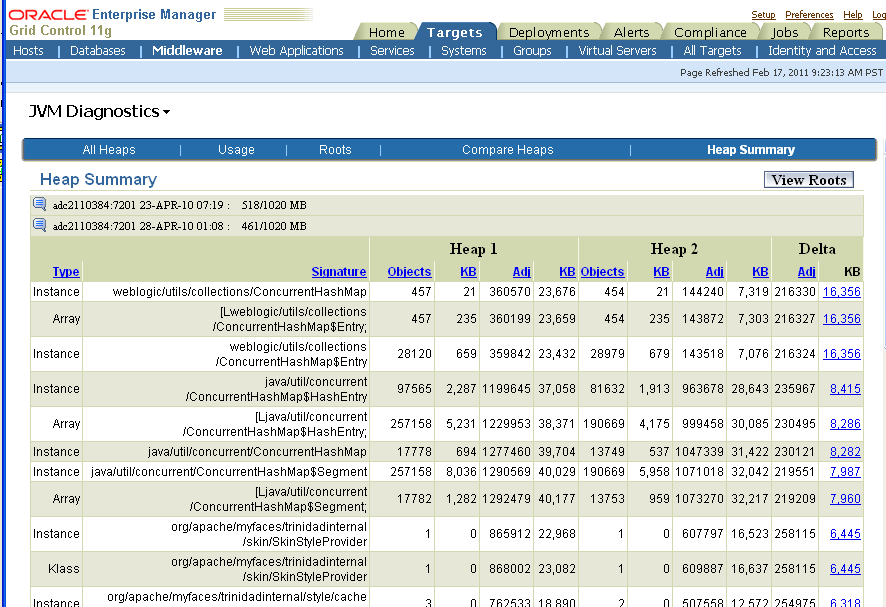
13. You can see heap comparison as given screen shots.
 14. Click on View Summary to get summary details.
1. Goto Targets->Middleware->JVM Diagnostics page
2. Select target JVM on left Panel
3. Select JVM Menu->Heap->Take Snapshot Now as given in screen shot.

Heapdump filename would be given in next screen and it would be like
/tmp/heapdump<N>.txt .(Default directory for a JVM is /tmp or C:\tmp)

4. Similar way, take another heap snapshot.
5. One you have two heapdump files on target JVM machine. ftp these files to or EM repository machine.
6. Download loadheap.zip from Targets->Middleware->JVM Diagnostics->Setup->Download page. Unzip loadheap.zip, it contains various scripts including :
-loadheap.sh/loadheap.bat,
-create_jvm_diagnostic_db_user.sh/create_jvm_diagnostic_db_user.bat scripts etc.
%create_jvm_diagnostic_db_user.sh
7. Create JVMDIAG user using create_jvm_diagnostic_db_user.sh/bat script.
Note: Use http://download.oracle.com/docs/cd/E11857_01/install.111/e17558/ad4j_setup.htm#CEGGIIBB
8. Load these heapdump files to EM repository as JVMDIAG user using loadheap.sh/bat.
%loadheap.sh <heapdump_filename>
Once both the files are loaded successfully.
9. Goto Targets->Middleware->JVM Diagnostics. Select Pool/JVM->Heap->Saved Heap Snapshots on right panel.

It will give list of loaded heaps in EM repository.

10. Select one heap using % column.
11. Click on 'Compare Heaps' on blue ribbon
12. Select second heap using same % column
13. You can see heap comparison as given screen shots.