OEM supports monitoring of Tomcat Apache Server
-Version 11.1.0.1.0
-Release 12 (1.0.3.1.0)
-Release 6 (1.0.3.0.0).
Metrics for Tomcat apache server are listed at
Once a Tomcat target is discovered, administrator can
generate reports and alerts for this target via OEM.
Reports
Many OOB reports are provided for Apache Tomcat. e.g.
- Apache Tomcat Load - Charts of total load on all global request processors
- All Applications Load- Applications load charts at server level
- Apache Tomcat Thread Pools- Thread pools active threads and total thread charts
- Datasources- Datasources active connections and idle connections charts
- Global Request Processors Load And Performance- Global request processor load and performance charts
- Memory Utilization- Resource utilization charts
- Top 10 Applications Based On Total Sessions- Top 10 applications based on sessions created during the last 24 hours
- Top 10 Servlets Based On Total Requests- Top 10 servlets by number of requests on each servlet during the last 24-hours
Additionally, custom reports can also be generated based
on data stored in the Management Repository.
Alerts
One can configure OEM to send alerts notifying the
problems with the target. To receive alerts on the console, specify warning
and/or critical threshold levels for relevant metrics.
- Choose Metric and Policy Settings on any target home page.
- From the Metric Thresholds page, one can either modify warning and/or critical thresholds directly from the table. Alternatively, click the Edit icon to access the Edit Advanced Settings page.
An alert is triggered when one of the following
conditions is true:
-A metric
threshold is reached
-The
availability of a monitored service changes
-A
metric-specific condition occurs
Deploy the Tomcat Apache plug-in
1. Download the Apache Tomcat plug-in archive file from
http://www.oracle.com/technetwork/oem/grid-control/downloads/plugin-apache-tomcat-159957.html.
2. Log in to OEM as a Super Administrator.
3. On the Grid Control Home page, from the upper-right
corner of the page, click Setup.
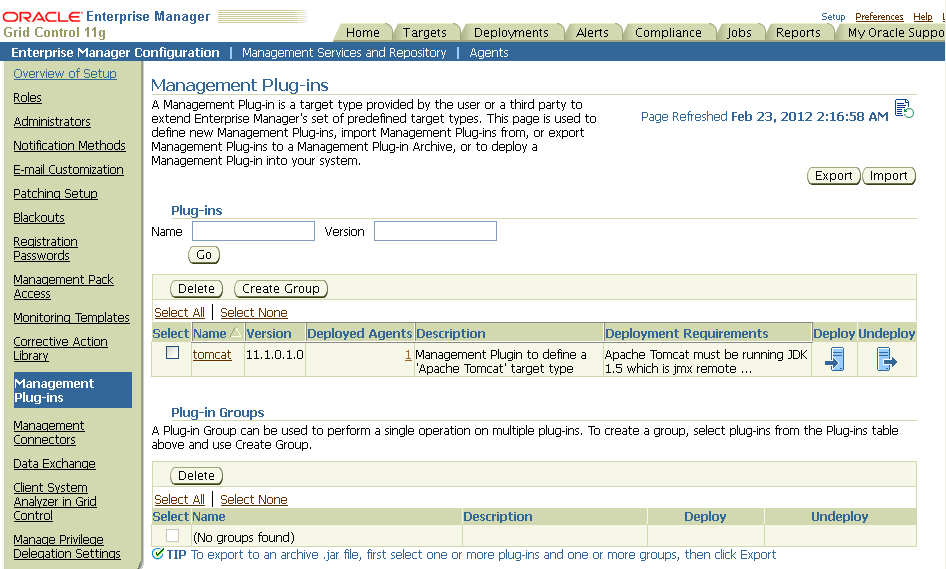
4. On the Setup Page, from the left panel, click
Management Plug-ins. The Management Plug-ins page appears.
5. On the Management Plug-ins page, click Import.
6. On the Import Management Plug-ins page, in the Select
Management Plug-in Archive section, click Browse and select the plug-in
archive.
7. Click List Archive.
8. Select the plug-in and click OK.
9. On the Management Plug-ins page, from the table, find
the name of the Apache Tomcat target, and click the icon in the Deploy column.
The Deploy
Management Plug-in wizard appears.
10. On the Deploy Management Plug-in: Select Targets
page, click Add Agents and select one or more Management Agents to which you
want to deploy the plug-in.
The wizard
reappears and displays the Management Agents you selected.
11. Click Next, then click Finish.
Note: If you see an error message stating that the
preferred credential is not set up, go to the Preferences page and add the preferred
credentials for the Agent target type. To access the Preferences page, from the
top-right corner of the Grid Control console, select Preferences.
If there are no errors, then you will see the following
screen:
Once the plug-in is deployed, we can add Tomcat instance
to monitor it.
Adding Tomcat Instance
1. Login to OEM console. Go to Targets tab, and then the
All Targets subtab.
2. On the All Targets page, from the Search list, select
Agent and click Go.
3. From the list Agents displayed in the table, identify
the Agent where the Apache Tomcat plug-in is deployed.
4. Click the name of the identified Agent. The Agent Home
page appears.
5. On the Agent Home page, in the Monitored Targets
section, from the Add list, select the Apache Tomcat target type and then click
Go.
6. The Add Apache Tomcat page appears.
7. On the Add Apache Tomcat page, provide the following
information for the properties:
- Host— Host of the Apache Tomcat instance. This property is MUST.
- JMX Port Number — Remote JMX port. This property is MUST.
- JMX User Name — Required when authentication is enabled for JMX.
- JMX Password — Required when authentication is enabled for JMX.
- Communication Protocol — Communication protocol used by remote JMX client. Do not change the default value specified unless the remote JMX implementation has changed.
- Service Name— JMX service name. Do not change the default value specified unless the remote JMX implementation has changed.
- SSL Trust Store—Required when SSL is enabled for Apache Tomcat.
- SSL Trust Store JMX Password— Required when SSL is enabled for Apache Tomcat.
- Apache Tomcat Version—Version of Apache Tomcat, e.g. 5.0.3, 5.5.23, etc. This property is MUST, and is used to determine the specific performance metrics to be monitored and/or collected.
Note: You must not change the default values of
Communication Protocol and Service Name unless the remote JMX

Validating the deployed Plug-in
1. Wait for a few minutes for the plug-in to start
collecting data.
2. On the Agent home page, from the Monitored Targets
table, click the Apache Tomcat target link.
3. The Apache Tomcat home page appears.

4. Verify that no metric collection errors are reported
in the Alerts section.
5. Ensure that reports can be seen and no errors are
reported by selecting the Reports property page.

